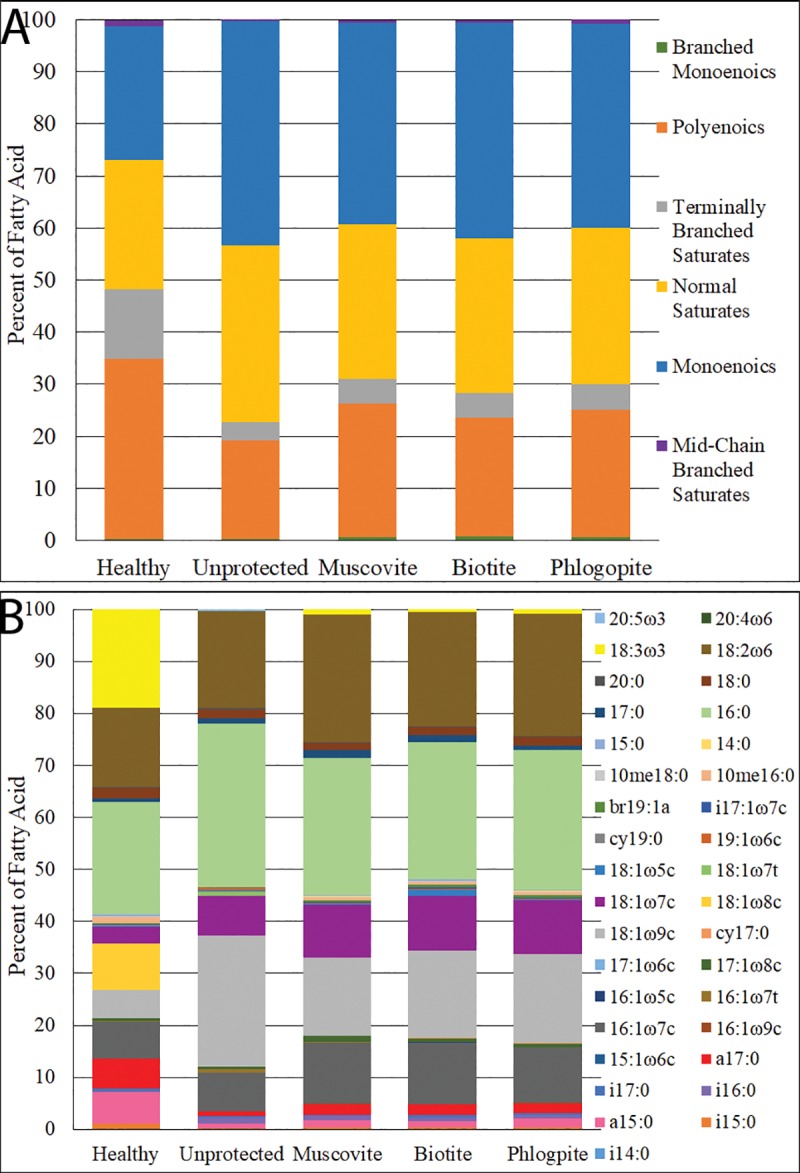
Fig 9. Alterations in fatty acid compositions of Leptolyngbya populations after exposure to UVB for 24 hrs.

Classes of acids are shown in (A), while individual fatty acids are shown in (B). These shifts are indicative of cellular changes due to UVB exposure, with the largest change shown between the healthy and unprotected cells. The thickness of all three mica minerals was ~0.1 mm.
