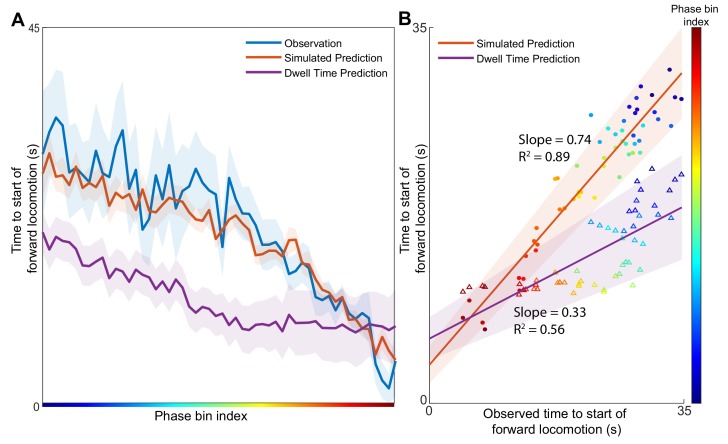
Figure 3. Position in the phase space determines the expected time of future behavioral transitions.
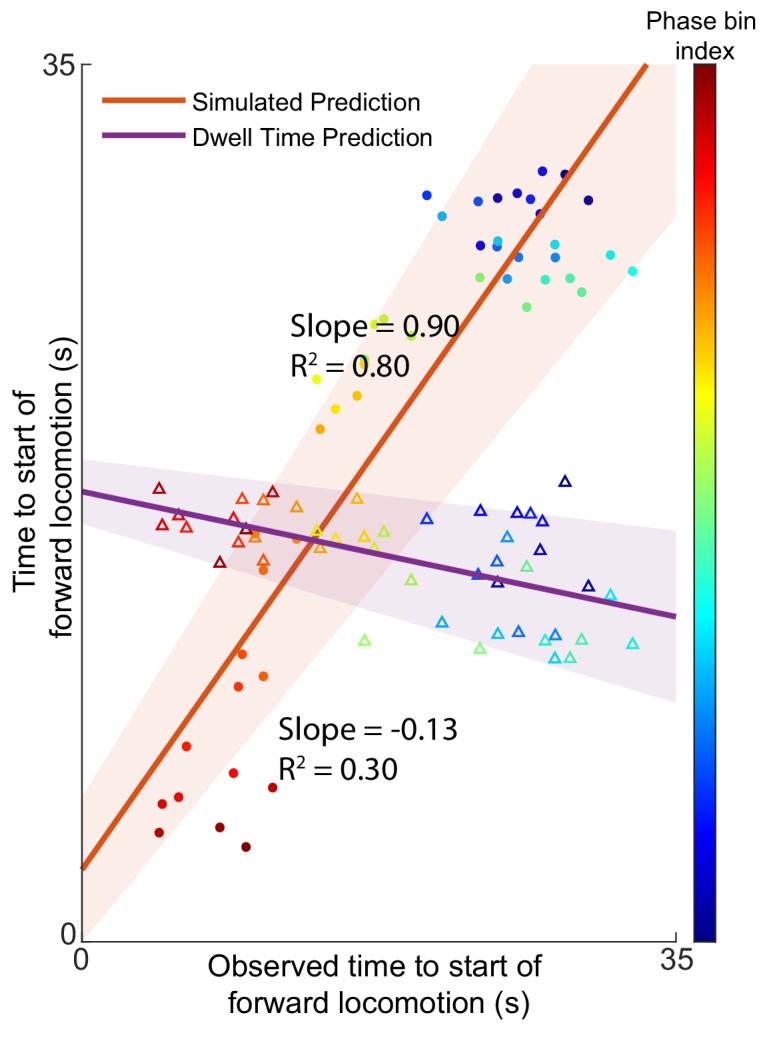
We explore the region of phase space where most instances of motor commands for backward locomotion are terminated and give rise to commands for forward locomotion. (A) The distribution of times to start of forward locomotion (orange line → mean, orange shading → 95% confidence intervals) is simulated as a function of starting phase. Observed distribution of times to start of forward locomotion in 11 new animals from Nichols et al. (blue line → mean, blue shading → 95% confidence intervals) are calculated for each phase bin in the same region. For each phase bin we also computed the average time since onset of backward locomotion. We then used this average time and the dwell time distribution of backward locomotion to calculate the expected time of termination of backward locomotion (purple line → mean, purple shading → 95% confidence intervals) (Materials and methods). This null hypothesis is grossly inaccurate. (B) Times to start of forward locomotion for both the simulation (orange line → mean, orange shading → 95% confidence intervals, filled circles), and the null model built on dwell times (purple line → mean, purple shading → 95% confidence intervals, empty triangles) are plotted against the time to start of forward locomotion command of the newly observed Nichols et al. animals. Individual points show the average time to start of forward locomotion for each individual phase bin (point color). The simulation (orange) is a good predictor of the newly observed data. In contrast, the null model based on dwell times (purple) consistently underestimates the time until initiation of forward locomotion (p < 0.0001).
Figure 3—figure supplement 1. Predictions of expected time to switch of behavior are still valid without AVA.


