. 2019 Jun 19;8:e43761. doi: 10.7554/eLife.43761

Figure 7. Projection patterns of the control cases 5a and 5b.

(A) Cumulative percent cell count across areas. Cutoff remarks: green line = 50%, red line = 75%, gray line = 100%. Areas after 100% are in a random order. (B) Illustration of the FC regions with strong projections following the same schema as in Figure 5. Red triangle marks the location of the injection.

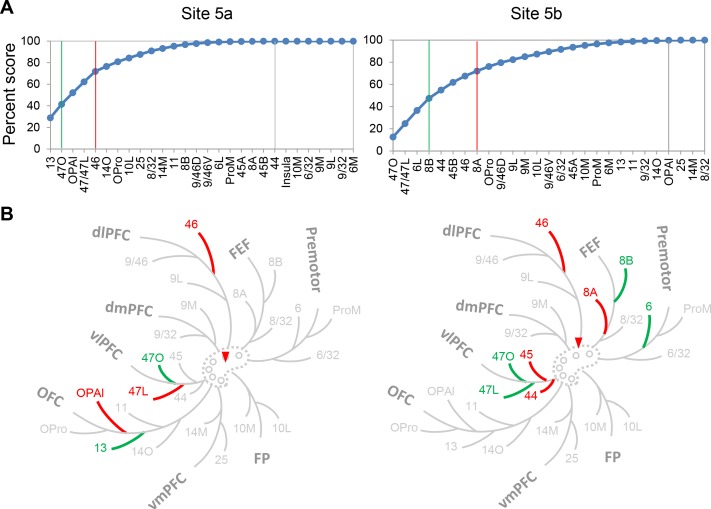
Figure 7.

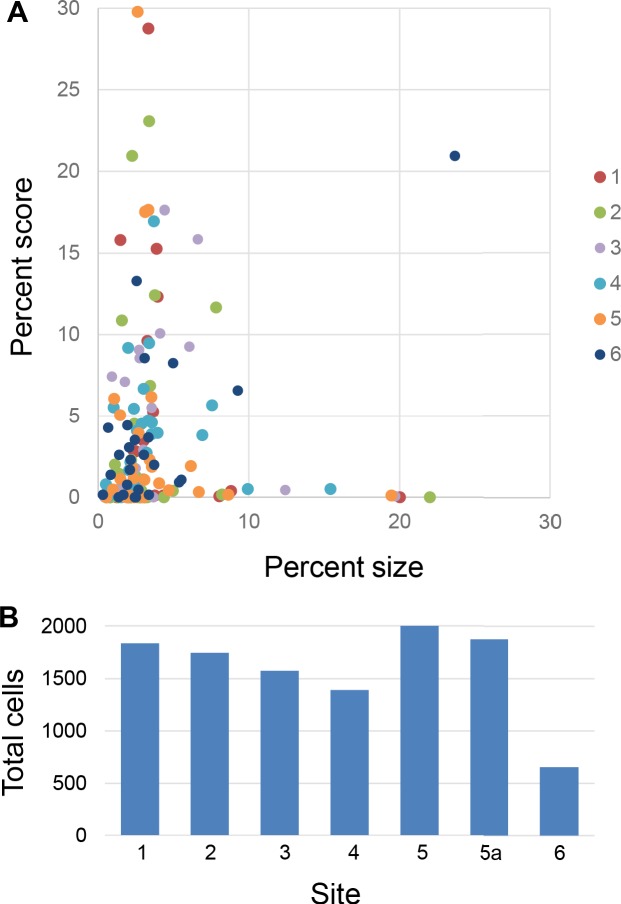
Figure 7—figure supplement 1. Percent scores of retrogradely labeled cells were not dominated by the size of the injection site or that of the FC areas.

Figure 7—figure supplement 1.

(A) Percent scores of labeled cells projecting to each site were not determined by the size of FC areas. The size was measured as the volume of each area divided by the total volume of all areas. Colors mark different sites. (B) Total number of labeled cells in each case.
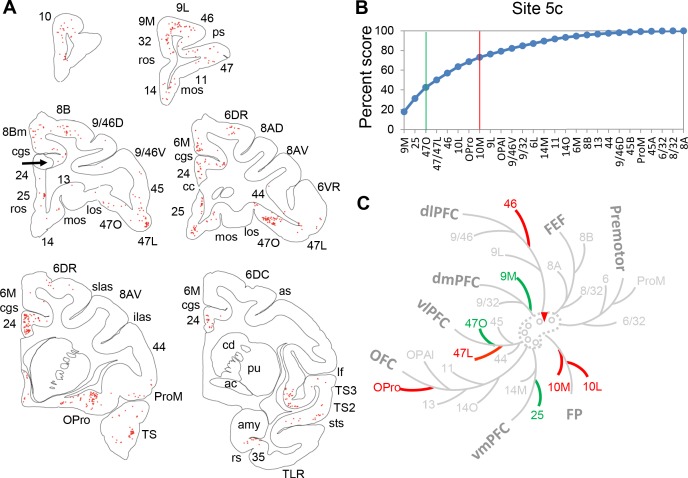
Figure 7—figure supplement 2. Projection patterns from the FC areas to control site 5 c.

Figure 7—figure supplement 2.

(A) Coronal slides matching those shown in Morecraft et al. (2012) for case 3. Each red dot represents a labeled cell. Arrow points to the injection site. (B) Cumulative percent cell counts across FC areas. Cutoff remarks: green line = 50%, red line = 75%, gray line = 100%. Areas after 100% are in a random order. (C) Illustration of the FC regions with strong projections following the same schema as in Figure 5. Red triangle marks the location of the injection.