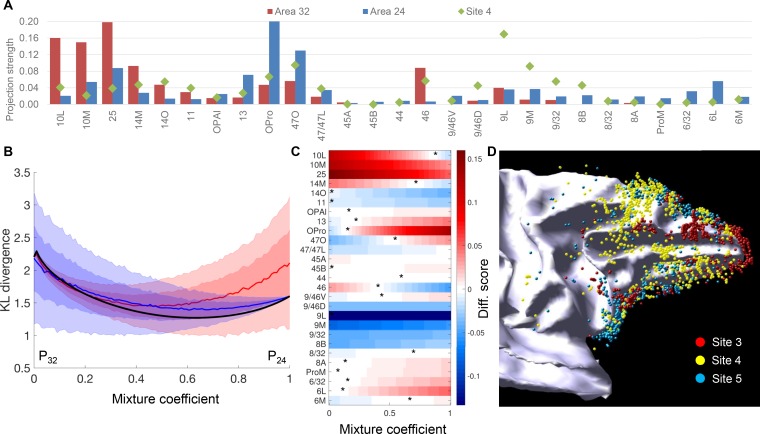
Figure 8. Comparison of projections to site 4 with those to areas 32 and 24.
(A) Projection strength across FC areas. Site 4: projection strength = percent cell count; area 32: projection strength = averaged percent cell count across sites 1–3; area 24: projection strength = averaged percent cell count across sites 5 and 6. (B) Comparison of site 4 cell counts to mixtures of connectivity profiles of nearby areas 32 and 24. The comparison uses the symmetric Kullback-Leibler divergence as a measure of distance between the normalized cell counts histograms. Although the distance is minimized for a mixture of approximately 2/3-1/3, this mixture is indistinguishable from mixing the distributions of areas 32 or 24 with a uniform distribution (shaded areas show mean +1 std (dark) and 2std (light) calculated with 10000 histograms of a uniform distribution). (C) Colors show the difference between the percent counts of site 4 compared to a linear mixture of areas 32 and 24. Optimal mixtures for individual target areas, corresponding to the color white, shows that the optimal mixture coefficient is variable across areas, but seven areas do not have an optimum (all red or all blue). (D) A 3D model of retrogradely labeled cells of sites 3, 4 and five on the white matter surface.

