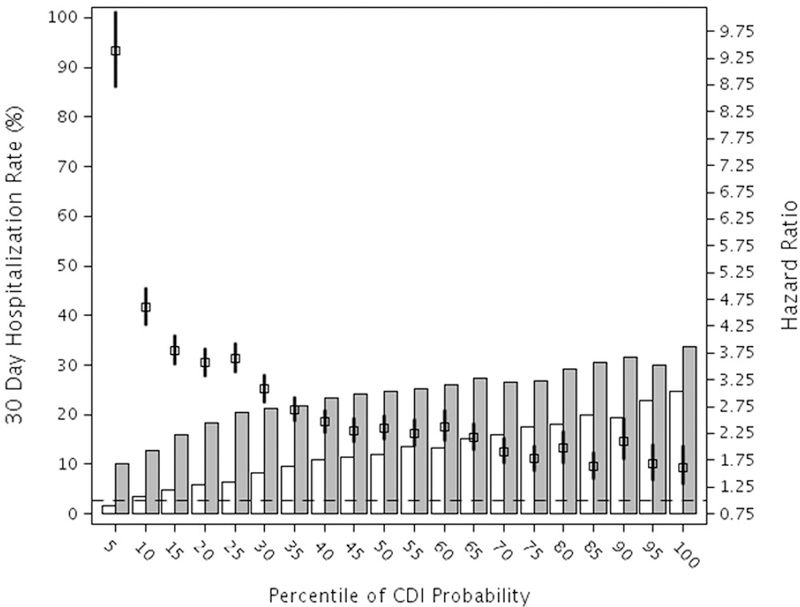
Figure 2.

Stratified Hazard Ratios and Rates of Hospitalization within 30 days after CDI or Control Index Date. The number of total patient included in the hospitalization analyses was 1,475,045 (158,558 CDI case patients and 1,316,487 control patients), after excluding 18,396 persons who died during the index hospitalization. The bars represent the hospitalization rates in control patients (open bars) and CDI case patients (grey bars).
 Hazard ratio and 95% confidence interval. The null hazard ratio of 1.0 is indicated by the horizontal dashed line.
