

Abstract
Background:
Metabolic flexibility can be assessed by changes in respiratory exchange ratio (RER) following feeding. Though metabolic flexibility (difference in RER between fasted and fed state) is often impaired in individuals with obesity or type 2 diabetes, the cellular processes contributing to this impairment are unclear.
Materials and Methods:
From several clinical studies we identified the 16 most and 14 least metabolically flexible male and female subjects out of >100 participants based on differences between 24-hour and sleep RER measured in a whole-room indirect calorimeter. Global skeletal muscle gene expression profiles revealed that, in metabolically flexible subjects, transcripts regulated by the RNA binding protein, HuR, are enriched. We generated and characterized mice with a skeletal muscle-specific knockout of the HuR encoding gene, Elavl1 (HuRm−/−).
Results:
Male, but not female, HuRm−/− mice exhibit metabolic inflexibility, with mild obesity, impaired glucose tolerance, impaired fat oxidation and decreased in vitro palmitate oxidation compared to HuRfl/fl littermates. Expression levels of genes involved in mitochondrial fatty acid oxidation and oxidative phosphorylation are decreased in both mouse and human muscle when HuR is inhibited.
Conclusions:
HuR inhibition results in impaired metabolic flexibility and decreased lipid oxidation, suggesting a role for HuR as an important regulator of skeletal muscle metabolism.
Keywords: Metabolic Flexibility, Skeletal Muscle, RNA Homeostasis
1. Introduction
Metabolic flexibility allows for the adaptation of macronutrient oxidation based on substrate availability [1, 2], and is generally determined by the ΔRER between periods of feeding (carbohydrate oxidation = high RER) and periods of fasting (lipid oxidation = low RER) [1, 2]. 24-hour RER is typically increased relative to sleep RER, given the shift toward carbohydrate metabolism that occurs in the fed state [1]. A decrease in ΔRER indicates lower metabolic flexibility, or the impaired ability switch between carbohydrates and lipids as energy sources.
Skeletal muscle is of particular interest when considering metabolic flexibility. Skeletal muscle accounts for at least 60% of the shift toward glucose metabolism following insulin stimulation [3]; a decrease in skeletal muscle lipid metabolism can lead to accumulation of diacylglycerides and ceramides, which can interfere with insulin signaling [4]. Studies in human skeletal muscle have shown that fasting RERs are higher for subjects with type 2 diabetes or insulin resistance compared to lean subjects, indicating decreased lipid oxidation. Importantly, muscle RER increases less in response to insulin or glucose infusion in an insulin-resistant state, thus indicating impaired metabolic flexibility [5–7]. Even though skeletal muscle is a key contributor to metabolic flexibility, little is known about the molecular mechanisms governing this process.
We examined skeletal muscle for mechanisms contributing to impaired metabolic flexibility. After identifying more than 100 clinical study participants with complete metabolic data (hyperinsulimic-euglycemic clamps, 24-hour measures of energy metabolism in respiratory chambers, biopsied muscle samples, and stored primary myoblasts), we selected the 16 most and 14 least metabolically flexible subjects based on differences between 24-hour and sleep RER. Global skeletal muscle gene expression was analyzed in each participant. When compared to the muscle of metabolically inflexible subjects, mRNA transcripts controlled by the RNA-binding protein, HuR, were highly enriched in skeletal muscle of metabolically flexible humans.
HuR is an RNA-binding protein (RBP) that mediates a variety of cellular processes through its recognition and regulation of RNA transcripts. HuR acts by binding to AU-rich regions (ARE) in the 3’ untranslated region of RNA molecules in order to stabilize them and potentially promote their translation [8, 9]. In skeletal muscle, HuR plays a key role in differentiation via stabilization of the mRNA transcripts of many important myogenic factors such as myogenin, MyoD, and p21 [10, 11]. However, the role of HuR as a regulator of muscle metabolism is less clear. To better understand the function of HuR in metabolic flexibility we characterized mice with a skeletal muscle-specific knockout of elavl1, the gene encoding HuR (HuRm−/−) [10, 11]. HuR deletion in male mice results in impaired metabolic flexibility and an increase in hallmarks of insulin resistance. Lipid oxidation and mRNA expression studies in HuRm−/− mice and in human myotubes during HuR inhibition show that HuR may promote metabolic flexibility by enhancing lipid metabolism.
2. Materials and Methods
2.1. Human samples:
Human vastus lateralis samples from 15 men and 15 women were selected from clinical trials conducted at Pennington Biomedical Research Center (PBRC) and were available in the PBRC Biorepository. Over 100 participants were identified in various clinical trials run at PBRC (BARIA, EAT, and PROOF) on whom we had complete data on energy metabolism (respiratory chamber), carbohydrate metabolism (hyperinsulinemic euglycemic clamp), and skeletal muscle biopsy samples. We calculated metabolic flexibility using the difference between 24-hour RER and sleep RER as measured in a whole-room calorimetry chamber. 16 metabolically flexible (8 male, 8 female) and 14 metabolically inflexible (7 male, 7 female) subjects were identified for this study. The inclusion criteria of participants in the BARIA, EAT, and PROOF studies have been cited elsewhere [12–14]. Clamp procedures for determination of glucose disposal rate (GDR) are also cited elswhere [14]. Breifly, euglycemia was set at 120 mg/dL and acheived by varying the rate of 20% dextrose infusion. During step 1 of the clamp, insulin was primed at 100 mU/m2·min for 2.5 min (150 mL/hr), followed by 50 mU/m2·min for 2.5 min (75mL/hr) and maintained thereafter at 30 mL/hr. During step 2 of the clamp, insulin was primed at 400 mU/m2·min for 2.5 min (150 mL/hr), followed by 200 mU/m2·min for 2.5 min (75mL/hr) and maintained thereafter at 30 mL/hr.
2.2. Serial Analysis of Gene Expression (SAGE):
500 ng of RNA from the vastus lateralis biopsies of the 30 individuals in this study were subjected to SAGE-Seq analysis in the Genomics Core at PBRC. The SAGE analysis was performed as reported earlier [15, 16]. Briefly, gene expression profiling was performed by expression tag sequencing (SAGE) on an AB SOLiD 5500XL next-generation sequencing instrument using reagent kits from the manufacturer (Applied Biosystems, Foster City, CA). Sequence reads were aligned to human reference RefSeq transcripts (version mm9), via SOLiDSAGE (Applied Biosystems). Only uniquely mapped sequence reads were counted to generate the expression count level for each respective RefSeq gene. Genes were considered differentially expressed with a cutoff of 1.25-fold change at P < 0.05 and were evaluated for biological pathway enrichment using the Ingenuity Pathway Analysis tool. The SAGE dataset has been uploaded to the Gene Expression Omnibus (GEO) website (accession number GSE125892).
2.3. Animals:
Skeletal muscle-specific HuR-deficient mice (HuRM−/−) and littermate controls (HuRfl/fl) were bred as follows: Homozygous floxed Elavl1 mice were purchased from Jackson Laboratories [8] (Stock # 021431) and bred to mice expressing Cre recombinase under the control of the Mlc1f promoter [17] (Jackson Laboratories, Stock # 024713) to delete HuR in skeletal muscle. All mice were on C57BL/6 background. Mice were group-housed at room temperature (RT) under a 12:12 h light:dark cycle and allowed ad libitum access to food and water. Mice were fed rodent breeder chow (Purina Rodent Chow #5015, Purina Mills, St. Louis, MO), which provides 20% of calories from protein, 26% from fat, and 54% from carbohydrate. All mice were 5 months old at sacrifice and,unless otherwise stated, mice were multi-housed. At 20 weeks of age, mice were euthanized by cervical dislocation and tissues were collected, snap-frozen in liquid nitrogen, and stored at −80°C for subsequent analyses. Mice were sacrificed according to approved procedures of the Panel on Euthanasia of the American Veterinary Medical Association. Mixed gastrocnemius (MG) skeletal muscle was powdered and used for all assays presented, with the exception of elavl1 mRNA testing in a broad range of tissues.
2.4. Animal procedures:
Body composition was measured using a Bruker NMR Minispec (Bruker Corporation, Billerica, MA). Serum and plasma collections were performed by submandibular bleeding. Behavioral and indirect calorimetry studies were done in a 16-chamber Oxymax system (Columbus Instruments, Columbus, OH) as described previously [18, 19]. Glucose tolerance tests were performed after a 4h fast as previously described [20, 21]. Briefly, after measuring baseline tail vein blood glucose levels, mice received a 0.2mL intraperitoneal injection of 20% D-glucose (40mg glucose per mouse) and blood glucose levels were subsequently monitored at 20min, 40min, and 60min post-injection. Insulin tolerance tests were performed in the fed state as previously described [20, 21]. Briefly, after measuring baseline tail vein blood glucose levels, each mouse received 0.04 U of insulin in 0.2mL phosphate buffered Saline (Sigma). Blood glucose levels were subsequently monitored at 20min, 40min, and 60min post-injection.
2.5. Human skeletal muscle myoblast culture:
Cryopreserved male human skeletal muscle myoblasts at passage 5 were used for RNA and oxidation assays. These cells were donated from lean males of European descent (n=12) [12]. Cells were subcultured onto 12-well culture plates and grown to 80-90% confluencey as described previously [22]. Cells were then differentiated into fused multinucleated myotubes for 3-5 days until myotubes were observed throughout the culture by switching to DMEM (Gibco) supplemented with 2% horse serum. Scramble siRNA (UUCUCCGAACGUGUCACGUdTdT) and HuR siRNA (CGUAAGUUAUUUCCUUUAAdTdT) [23] were purchased from Sigma and transfected at 50nM final concentration using Lipofectamine 2000 (Invitrogen) and cells were used 72 h later. Two independent cultures with three separate trials were used for each gene expression assay. Three independent cultures with 3-6 separate trials were used for lipid oxidation assays.
2.6. RNA Isolation:
RNA was extracted from 20-30mg of powdered mouse tissue or from human myotubes using Trizol (ThermoFisher Scientific, Waltham, MA) as previously described [21, 24]. Briefly, samples were homogenized in 1 ml Trizol, allowed to sit at RT for 5 min, and then 0.2 ml of chloroform was added. The samples were shaken vigorously for 15 sec and allowed to sit at RT for 2-3 min before they were centrifuged (12,000 × g; 15 min; 4°C) to induce phase separation. Roughly 600 μl of the upper aqueous supernatant containing RNA was transferred to a new microcentrifuge tube whereupon 600 μl of 70% ethanol was added and the samples were vortexed. RNA was then isolated using an RNeasy kit (Qiagen, Valencia, CA) with DNAse treatment per manufacturer’s instructions. RNA content and quality (260/280 ratio range 1.9 - 2.1) were assessed using a Nanodrop 1000 and RNA was used for qPCR as well as downstream Serial Analysis of Gene Expression (SAGE) studies.
2.7. Quantitative RT-PCR:
Total RNA from tissues or cells was isolated as described in section 2.6 above. cDNA was then synthesized with an iScript cDNA synthesis kit and was used for qRT-PCR with the SYBR Green system (Bio-Rad). Analysis was conducted using the ΔΔCT procedure. Quantification of mouse or human cyclophilin B transcript was used in all experiments as the control for normalization of gene expression. Primer details are provided in Supplementary Table 2.
2.8. Serum protein, non-esterified fatty acids, and 3-hydroxybutyrate analysis:
An ELISA kit was used for measurement of fed serum insulin levels (Crystal Chem, Elk Grove Village, IL), according to manufacturer’s instructions. 4 hour fasted serum non-esterified fatty acids (NEFA) and 3-hydroxybutyrate (3-HB) were measured using commercial kits (Wako Diagnostics, Richmond, VA).
2.9. Western blot analysis:
Protein homogenates were prepared from muscle tissue in Cell Lysis Buffer (EMD Millipore, Danvers, MA, USA). Immunoblot analyses were performed using standard procedures followed by ECL detection. Antibodies used were HuR G-8 (Santa Cruz Biotechnology).
2.10. Substrate Oxidation Assays:
Fatty acid oxidation was measured as the liberation of 14CO2 from [1-14C]-palmitate. For tissue homogenates mixed gastrocnemius muscle was prepared as previously described [25] [21, 26]. Oxidation of palmitate (200 μM) was measured over the course of 30 min in reaction media (pH 7.4) consisting of: 100 mM sucrose, 60 mM EDTA, 10 mM Tris HCI, 10 mM K2HPO4, 80 mM KCl, 1 mM MgCl2·6H2O, 1 mM L-carnitine, 0.05 mM malate, 1 mM DTT, 0.05 mM nicotinamide-adenine dinucleotide, 2 mM ATP, and 0.05 mM CoA. Homogenates were incubated with or without 1mM pyruvate in order to measure inhibition of palmitate oxidation. For cell culture studies palmitate (100 μM) oxidation was performed in triplicate and repeated in three separate cultures. Incubations were measured over the course of 2h in cultured myotubes as previously described [27, 28] with the exception being that glucose/pyruvate-free DMEM (Thermofisher) was used as the stock media to maximize lipid catabolism. Cells were incubated with or without 5mM glucose and 1mM pyruvate in order to measure inhibition of palmitate oxidation.
2.11. Statistical analysis
Data are expressed as mean ± s.e.m. For animal studies, Microsoft Excel software was used for analysis of variance with paired two-tailed Student’s t-tests where normality was established using GraphPad Prism software and the D’Agostino-Pearson normality test. P≤0.05 was considered significant. For assays where sample sizes where < 8, Mann-Whitney U Tests were performed with GraphPad Prism software as a measure of significant differences with P<0.05 considered significant.
2.12. Study Approval
The protocols of all human studies were approved by the Institutional Review Board of PBRC, and all volunteers gave written informed consent. Animal studies were conducted at PBRC’s AALAC approved facility. All experiments complied with the NIH Guide for the Care and Use of Laboratory Animals, and approved by the PBRC Institutional Animal Care and Use Committee.
3. Results
3.1. Metabolically Flexible Subjects have Enriched HuR Target mRNAs in Skeletal Muscle.
The characteristics of the 16 metabolically flexible (8 males and 8 females) and 14 metabolically inflexible (7 males and 7 females) individuals are shown in Table 1. Participants had similar 24 hour RER, while metabolically inflexible subjects had an increased sleep RER relative to flexible participants. Consistent with this are data from a 2-stage hypersulinemic euglycemic clamp. GDR at 100 mU/m2 · min insulin infusion was not different between groups, but GDR at 500 mU/m2 · min was significantly higher for metabolically flexible subjects (Table 1). The flexible humans in this study thus have an increased response to high levels of insulin relative to inflexible participants, consistent with previous studies of metabolic flexibility [1, 2]. However, it should be noted that BMI, HOMA-IR, and GDR at the more physiological insulin level of 100 mU/m2 · min are no different between groups (Table 1). This demonstrates that the participants in this study differ in terms of metabolic flexibility, despite no differences in other confounding metabolic parameters.
Table 1: Metabolic data for human subjects included in this study.
GDRstage1 was determined at an insulin infusion of 100 mU/m2 · min, while GDRstage2 was determined at an insulin infusion of 400 mU/m2 · min.
| Metabolically Inflexible N = 14 |
Metabolically Flexible N = 16 |
P-value | |||
|---|---|---|---|---|---|
| Age [years] | 33.9 | ± 13.0 | 26.1 | ± 6.3 | 0.041* |
| Weight [kg] | 90.7 | ± 23.6 | 92.8 | ± 30.7 | 0.506 |
| BMI [kg/m2] | 31.2 | ± 8.7 | 29.9 | ± 10.9 | 0.715 |
| Waist circumference [cm] | 99.7 | ± 22.7 | 93.9 | ± 27.8 | 0.542 |
| Body fat [%] | 34.3 | ± 12.1 | 28.2 | ± 14.6 | 0.226 |
| Fat mass [kg] | 32.1 | ± 18.0 | 26.4 | ± 23.7 | 0.467 |
| Fat-free mass [kg] | 58.6 | ± 14.1 | 57.8 | ± 13.4 | 0.879 |
| 24 h EE [kcal/d] | 2164 | ± 436 | 2042 | ± 374 | 0.416 |
| Sleep metabolic rate [kcal/d] | 1768 | ± 324 | 1639 | ± 263 | 0.238 |
| 24 h RER | 0.90 | ± 0.03 | 0.89 | ± 0.06 | 0.536 |
| Sleep RER | 0.90 | ± 0.03 | 0.84 | ± 0.08 | 0.006* |
| HOMA-IR | 2.4 | ± 0.42 | 1.6 | ± 0.26 | 0.134 |
| Fasting glucose [mg/dl] | 96.2 | ± 10.3 | 93.2 | ± 9.0 | 0.398 |
| GDRstage1 [mg/kg/min] | 2.42 | ± 0.29 | 2.62 | ± 0.24 | 0.595 |
| GDRstage2 [mg/kg/min] | 11.04 | ± 0.83 | 8.61 | ± 0.77 | 0.042* |
P<0.05 and significantly different between groups.
SAGE datasets revealed through Ingenuity Pathway Analysis (IPA) that, in both males and females, networks of HuR target transcripts were enriched in skeletal muscle of the metabolically flexible participants compared to inflexible individuals (Figure 1). At the individual gene level, several HuR-stabilized transcripts were among the most robustly enriched in metabolically flexible males and females relative to the inflexible subjects. The fold increases along with the p values for each of the identified genes in the pathway are presented in Supplementary Table 1.
Figure 1: Transcriptomics analysis predicts enrichment of HuR-controlled transcripts in metabolically flexible humans.

HuR-controlled transcript expression patterns as determined by Ingenuity Pathway Analysis (IPA) and Gene Set Enrichment Analysis (GSEA) in vastus lateralis muscle from females (A) of males (B) classified as either metabolically inflexible or metabolically flexible.
3.2. Male Skeletal Muscle HuR Knockout Mice have Increased Adiposity and Insulin Resistance.
Because our transcriptomics data suggested that HuR may be involved in the control of metabolic flexibility, we hypothesized that HuR was a key regulator of muscle substrate metabolism. Therefore, we created skeletal muscle-specific HuR knockout mice (HuRm−/−). Quantitative rt-PCR and western blot confirmed deletion of elavl1 and thus HuR selectively and specifically in skeletal muscle of HuRm−/− mice (Figures 2A–C). No significant differences in elavl1 mRNA expression between HuRm−/− and HuRfl/fl mice were found in any other tissues tested. Since HuR is essential for skeletal muscle cell differentiation in cell culture [10, 11, 29], we performed H&E staining of gastrocnemius muscle to ensure that HuR deletion did not affect cellular morphology (Supplementary Figure 1A).
Figure 2: HuR deletion in male skeletal muscle results in decreased insulin sensitivity and metabolic inflexibility.

A) Relative gene expression of Elavl1 in HuRfl/fl (black) and HuRm−/− (white) tissues (n=4-5). B) Western blot confirming knockout of HuR in HuRm−/− gastrocnemius. C) Densitometry of immunoblots (n=6). D) Fat mass gain for HuRfl/fl (black squares) and HuRm−/− (white circles) (n=17-20 mice per time point). E) Glucose tolerance tests (GTT) for HuRfl/fl (black squares) and HuRm−/− (white circles) (n=17-20). F) Insulin tolerance tests (ITT) for HuRfl/fl (black squares) and HuRm−/− (white circles) (n=19-23) G) Fed serum insulin levels for HuRfl/fl (black) and HuRm−/− (white) mice (n=9). ΔRER per gram of food eaten for HuRfl/fl (black squares) and HuRm−/− (white circles) (n=33).
Male HuRm−/− mice display a mild, but significant, increase in fat mass relative to HuRfl/fl littermates beginning at 9 weeks of age and continuing through 20 weeks of age (Figure 2D). At 20 weeks of age, male HuRm−/− mice also display higher blood glucose levels following glucose and insulin tolerance tests (GTT and ITT, respectively); and exhibit significantly higher basal insulin levels relative to HuRfl/fl animals (Figure 2E–G). Fasting blood glucose levels are similar between groups, despite HuRm−/− mice having higher insulin levels, consistent with whole body insulin resistance [30]. Insulin resistance has classically been associated with higher levels of free fatty acids and ketone bodies in serum [31, 32]. However, we found no significant differences in serum levels for non-esterified fatty acids (NEFA) and 3-hydroxybutyrate (3-HB) between groups (Supplementray Figure 1B).
In contrast to male animals, female HuRm−/− mice are protected from the excess adiposity phenotype (Supplementary Figure 2A). Additionally, female HuRm−/− mice do not exhibit defects in glucose homeostasis such as elevated blood glucose during GTT or ITT (Supplementary Figure 2B–C). Because of the absence of a distinguishable phenotype in female animals, only male mice were used for subsequent studies.
3.3. HuR Knockout in Mouse Skeletal Muscle Leads to Decreased Lipid Oxidation and Metabolic Inflexibility.
Despite significant elevations in the RER of HuRm−/− mice during both light and dark cycles when compared to floxed controls (Figure 3A), no differences in caloric intake were observed between genotypes (Supplementary Figure 3A). Given that increased energy intake was not a likely driver of the observed increase in RER , we hypothesized that HuRm−/− skeletal muscle may not oxidize lipids as efficiently as HuRfl/fl skeletal muscle. We measured palmitate oxidation in gastrocnemius homogenates from HuRm−/− mice and found a 15% decrease in complete palmitate oxidation relative to HuRfl/fl mice (Figure 3B). We also observed decreased transcript levels for several genes involved in skeletal muscle fatty acid metabolism and oxidative phosphorylation in HuRm−/− mouse muscle (Figure 3C).
Figure 3. Skeletal muscle HuR inhibition results in decreased lipid oxidation and decreased metabolic flexibility in mice.
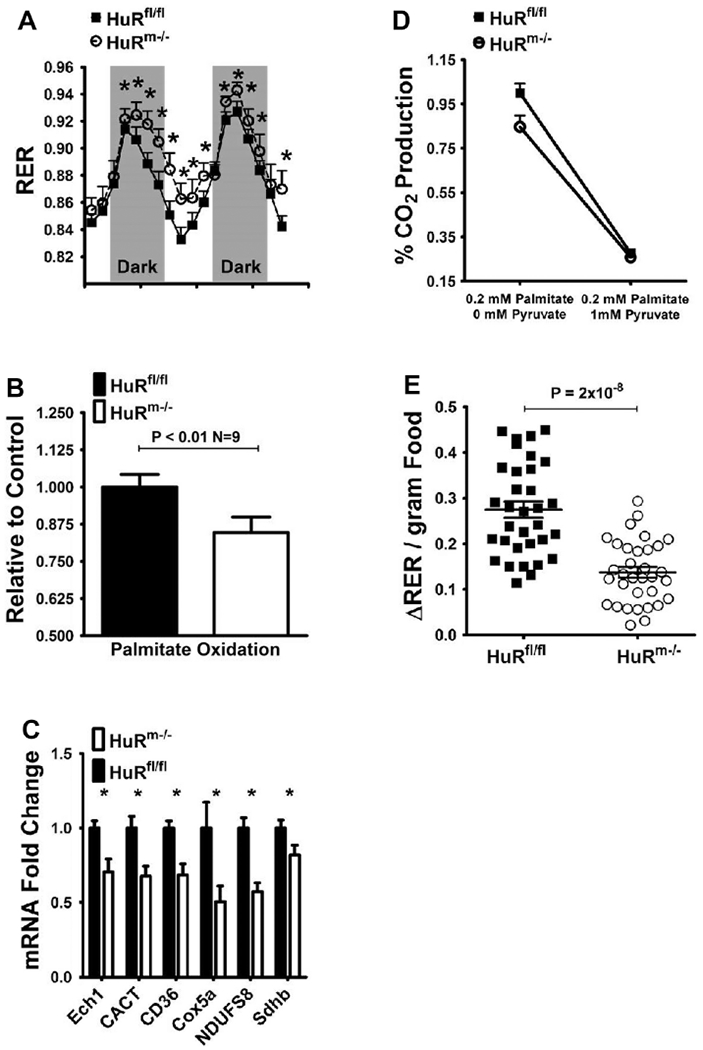
A) Respiratory exchange ratios (RER) for HuRfl/fl (black squares) and HuRm−/− (white circles) (n=6). B) Palmitate oxidation as measured by CO2 production in gastrocnemius homogenates from HuRfl/fl (black) and HuRm−/− (white) mice (n=9). C) Relative expression of fatty acid metabolism and oxidative phosphorylation genes in HuRfl/fl (black) and HuRm−/− (white) mouse tissues (n=8). All mice were 20 weeks of age. D) Palmitate oxidation as measured by CO2 production in gastrocnemius homogenates from HuRfl/fl (black squares) and HuRm−/− (white circles) mice (n=9) in the absence or presence of 1mM pyruvate. E) Change in RER per gram of food eaten for HuRfl/fl (black squares) and HuRm−/− (white circles) mice (n=35).
We then assessed the metabolic flexibility of HuRm−/− skeletal muscle by measuring palmitate oxidation in the presence of 1mM pyruvate. In these experimental conditions, the conversion of pyruvate to acetyl-coA can compete with lipid oxidation for entry into the citric acid cycle [25]. In the presence of pyruvate, lipid oxidation in HuRfl/fl mouse muscle decreases to 28% of the level observed without pyruvate. For HuRm−/− gastrocnemius, palmitate oxidation decreases to 26% of the maximal level observed in HuRfl/fl gastrocnemius (Figure 3D). These differences equate to a 72% decrease in palmitate oxidation from baseline for HuRfl/fl skeletal muscle; and only a 59% decrease from baseline for HuRm−/− skeletal muscle. Thus, at the skeletal muscle level, HuRm−/− mice show decreased lipid oxidation and decreased metabolic flexibility relative to HuRfl/fl mice.
Next, we assessed whether the metabolic inflexibility observed in skeletal muscle was reflected at the whole body level in HuRm−/− mice by comparing ΔRER values determined after 0.1-0.3g food intake. HuRm−/− and HuRfl/fl mice show similar linear increases in RER with greater consumption of food (Supplementary Figure 3B); however, ΔRER/gram food remains significantly lower for HuRm−/− mice regardless of the amount of food ingested (Figure 3E). This finding indicates that, at the whole body level, HuRm−/− mice are less metabolically flexible than their HuRfl/fl littermates.
3.4. HuR Silencing in Male Human Myotubes Demonstrates Translation of the Metabolically Inflexible Phenotype.
To assess the translatability of metabolic inflexibility in skeletal muscle lacking HuR, we used pooled male human skeletal muscle cells treated with ELAVL1 siRNA. Since HuR plays an important role in muscle cell differentiation [10, 11, 29], myotubes were treated with siRNA 3-5 days post-differentiation. In the presence of ~80% ELAVL1 knockdown (Figure 4A), human myotubes exhibit similar decreases in the expression levels of the same lipid metabolism and oxidative phosphorylation genes that are decreased in HuRm−/− mice (Figure 4B). Compared to mouse gastrocnemius homogenates, palmitate oxidation is more robustly decreased by 32% during HuR inhibition in human myotubes (Figure 4C).
Figure 4. HuR inhibition in human myotubes results in decreased lipid oxidation and decreased metabolic flexibility.

A) Relative expression of ELAVL1 mRNA in cultured male human myotubes with (white) and without (black) siRNA mediated inhibition of ELAVL1 (n=6). B) Relative expression of fatty acid metabolism and oxidative phosphorylation genes with (white) and without (black) siRNA mediated inhibition of ELAVL1 (n=6). C) Palmitate oxidation as measured by CO2 production in cultured human myotubes with (white) and without (black) siRNA mediated inhibition of ELAVL1 (n=12 wells total from 3 separate trials). D) Palmitate oxidation as measured by CO2 production in cultured human myotubes with (white circles) and without (black squares) siRNA mediated inhibition of ELAVL1 in the absence (n=12 wells total from 3 separate trials) or presence (n=6 wells total from 2 separate trials) of 1mM pyruvate and 5mM glucose. * P < 0.05, # P < 0.1.
As a means of testing metabolic flexibility in human myotubes, we determined the level of palmitate oxidation in the presence of 1mM pyruvate and 5mM glucose. Palmitate oxidation in the presence of pyruvate and glucose is decreased to 24% of baseline in cells treated with scramble siRNA (Figure 4D), whereas the decrease is only 17% of baseline in HuR siRNA-treated cells. This amounts to a 76% decrease from baseline palmitate oxidation for scramble siRNA-treated cells; and a 51% decrease from baseline palmitate oxidation for HuR siRNA treated-cells. Our data collectively reveal metabolic inflexibility and impaired skeletal muscle lipid oxidation in both mice and humans in the presence of HuR inhibition, which could lead to ectopic fat accretion and ultimately interfere with insulin signaling and glucose uptake.
4. Discussion
Indicators of metabolic flexibility (adaptation of metabolism to energy substrate availability) are becoming increasingly important in light of the contribution of metabolic inflexibility to the development of type 2 diabetes. Classical approaches to describing whole body and skeletal muscle metabolic flexibility have involved measurement of RER changes before and after insulin stimulation[1, 5, 33]. However, ΔRER based methods are reflective of the subject’s ability to stimulate cellular glucose uptake, and do not directly address differences in cellular lipid versus carbohydrate metabolism. Alternative assessments of lipid and carbohydrate oxidation in specific tissues from metabolically inflexible subjects are thus critical for describing susceptibility to development of metabolic disease.
Here, we demonstrate that metabolically inflexible human skeletal muscle exhibits decreased levels of gene transcripts controlled by the RNA binding protein, HuR. Importantly, parameters such as BMI, fasting blood glucose, and HOMA-IR did not differ significantly between groups in this study (Table 1). Metabolically inflexible participants thus differed from metabolically flexible by having higher sleep RER and a lower GDR following a high dose of insulin. These differences together with transcriptomics analysis from skeletal muscle indicate that independently of metabolic health, levels of HuR-regulated mRNA transcripts in human skeletal muscle correlate with metabolic flexibility. These findings thus suggest skeletal muscle HuR as an important contributor to whole-body metabolic flexibility.
With our HuRm−/− mouse model we demonstrate for the first time that loss of HuR causes impaired metabolic flexibility within skeletal muscle. While the action of HuR as a metabolic sensor has not been extensively defined, some reports have alluded to its involvement in cellular metabolism in various cell types. HuR reacts to systemic signaling and can be translocated to the cytoplasm in response to insulin action [34], and relocated to the nucleus following AMPK activation [35].
Within the cell, HuR binds to AREs in the 3’-untranslated regions of many mRNA transcripts to impart stability, influence nuclear export, and promote translation [8, 9]. Proteins such as Tristetraprolin (TTP) bind to similar ARE regions as HuR and decrease mRNA stability [36]. Inhibition or deletion of HuR could increase RNA interactions with mRNA destabilizing proteins and cause a decrease in the protein levels of HuR-stabilized transcripts. Many HuR-regulated transcripts stimulate metabolic pathways such as the mTOR pathway, which is extensively involved in the control of lipid metabolism [37]. Specifically, HuR is implicated in the upregulation of the mTOR stimulator, AKT, through its stabilization of Grb10 [38]. HuR has also been predicted to enhance the activity of mTORC2 by promoting translation of Rictor (the rapamycin insensitive component of mTOR) [39]. Therefore, it is likely that inhibition of HuR could decrease metabolic signaling proteins and lead to altered cellular metabolism.
Our results indicate that HuR is involved in the control of skeletal muscle lipid metabolism. In both mice and humans, we show that skeletal muscle HuR deletion results in a 15-30% decrease in total palmitate oxidation, which is suggestive of metabolic inflexibility. The inability to switch metabolism towards lipid oxidation during periods of fasting can lead to the cytosolic accumulation of fatty acyl-CoAs, diacylglycerol (DAG), and ceramides that are directly linked to impaired insulin signaling [33, 40–43]. Deletion or inhibition of HuR in skeletal muscle may indeed be contributing to such an impaired switching ability.
It is important to reiterate that the levels of HuR stabilized transcripts in skeletal muscle of metabolically inflexible participants in this study are decreased relative to metabolically flexible subjects, despite these groups showing no differences in other important markers of metabolic health such as BMI, HOMA-IR, and GDR at 100 mU/m2 · min insulin during clamp studies. These findings implicate a decreased ability to oxidize lipids in skeletal muscle as an important driver of whole body metabolic inflexibility.
The significant decreases of several mitochondrial metabolic genes during HuR knockdown in mice and human skeletal muscle further suggest decreased lipid oxidative capacity. CD36 and CACT are important mediators of fatty acid uptake and transport across the mitochondrial membrane, respectively. ECH1 is the enzyme catalyzing the initiating step of β-oxidation within mitochondria [44–46]. Decreases in these fatty acid handling enzymes in association with decreases in electron transport chain constituents such as COX5a, NDUFS8, and SDHB may indicate defects in mitochondrial function within HuRm−/− skeletal muscle. Indeed, impaired metabolite fuel selection has been predicted elsewhere to be accompanied by mitochondrial dysfunction [47, 48].
Through our competition experiments, we show that HuR knockdown results in lower metabolic flexibility in skeletal muscle. When human cells or muscle homogenates are provided with pyruvate and/or glucose as competitors to lipid oxidation, samples lacking HuR show a blunted shift away from lipid metabolism. The whole-body physiological consequences of this blunted switching ability are impaired insulin sensitivity, increased fat mass, increased serum insulin levels, and decreased metabolic flexibility as measured by RER. These results further implicate the action of HuR within skeletal muscle as an important control point for metabolic flexibility.
Several limitations exist in the current study that will be addressed in future studies examining the action of HuR in controlling metabolic flexibility. It is presently unclear which pathways are directly affected by HuR inhibition to lead to decreased metabolic flexibility. A more comprehensive analysis of how HuR controlled transcripts are affected during HuR inhibition in skeletal muscle is essential for revealing these pathways.
Of additional interest is the presence of a sexually dimorphic phenotype in HuRm−/− mice. Previous human studies have indicated that communication between metabolically active organs such as skeletal muscle, adipose tissue, and liver is differentially regulated in males versus females, contributing to greater metabolic flexibility in females [2, 49]. Our studies indicate that this sexual dimorphism translates from humans to mice, and thus further analysis of the crosstalk between metabolically active organs in male and female HuRm−/− mice will be an effective means of characterizing the observed sexual dimorphisms of human metabolic flexibility.
The results of this study indicate that HuRm−/− mice are a valuable model for studying metabolic flexibility and its contributions to increased fat mass and the development of insulin resistance. Additionally, decreased metabolic flexibility in the absence of HuR translates from mice to humans. Further determination of the mechanistic control of metabolic flexibility by HuR through mouse and human studies will thus have both diagnostic and therapeutic implications toward managing metabolic disease. Though further studies are crucial to understanding the role of HuR in the control of metabolism, our results provide insight into the mechanisms governing the ability of cells to switch between metabolic fuels.
Supplementary Material
Acknowledgments
We thank Estrellita Bermudez, Olga Dubuisson, and Tamra Mendoza for technical assistance. We thank the human-study participants and the staff of the PBRC inpatient and outpatient units.
Funding
This work was supported by National Institute of Diabetes and Digestive and Kidney Diseases (NIDDK) T32-DK-6458413 funded fellowship to J.D.W, and NIDDK Nutrition Obesity Research Centers (NORC) P30-DK-072476 funded P&F grant to J.D.W.. R.L.M was supported by NIDDK R01-DK-089641. C.M.E. was supported by NIDDK K01-DK-106307. S.G., R.L.M., E.R., and R.C.N. were supported in part by a Louisiana Clinical and Translational Science Center (LaCATS) P&F grant funded by National Institute of General Medical Sciences (NIGMS) GM-104940. This work used the PBRC Transgenic, Comparative Biology, and Genomics Cores; and the Clinical Research Laboratory supported in part by COBRE (NIGMS 8P20-GM-103528) and NIDDK NORC 2P30-DK-072476.
Abreviations
- RER
Respiratory Exchange Ratio
- RBP
RNA Binding Protein
- ARE
AU-rich Element
- GDR
Glucose Disposal Rate
- GTT
Glucose Tolerance Test
- ITT
Insulin Tolerance Test
- IPA
Ingenuity Pathway Analysis
- SAGE
Serial Analysis of Gene Expression
Footnotes
Publisher's Disclaimer: This is a PDF file of an unedited manuscript that has been accepted for publication. As a service to our customers we are providing this early version of the manuscript. The manuscript will undergo copyediting, typesetting, and review of the resulting proof before it is published in its final citable form. Please note that during the production process errors may be discovered which could affect the content, and all legal disclaimers that apply to the journal pertain.
Conflicts of Interest
The authors declare no conflict of interest.
References
- 1.Galgani JE, Moro C, Ravussin E. Metabolic flexibility and insulin resistance. Am J Physiol Endocrinol Metab. 2008;295(5):E1009–17. Epub 2008/09/04. doi: 10.1152/ajpendo.90558.2008. [DOI] [PMC free article] [PubMed] [Google Scholar]
- 2.Goodpaster BH, Sparks LM. Metabolic Flexibility in Health and Disease. Cell Metab. 2017;25(5):1027–36. Epub 2017/05/04. doi: 10.1016/j.cmet.2017.04.015. [DOI] [PMC free article] [PubMed] [Google Scholar]
- 3.Ng JM, Azuma K, Kelley C, Pencek R, Radikova Z, Laymon C, et al. PET imaging reveals distinctive roles for different regional adipose tissue depots in systemic glucose metabolism in nonobese humans. Am J Physiol Endocrinol Metab. 2012;303(9):E1134–41. Epub 2012/09/13. doi: 10.1152/ajpendo.00282.2012. [DOI] [PMC free article] [PubMed] [Google Scholar]
- 4.Moro C, Bajpeyi S, Smith SR. Determinants of intramyocellular triglyceride turnover: implications for insulin sensitivity. Am J Physiol Endocrinol Metab. 2008;294(2):E203–13. Epub 2007/11/16. doi: 10.1152/ajpendo.00624.2007. [DOI] [PubMed] [Google Scholar]
- 5.Kelley DE, Mandarino LJ. Hyperglycemia normalizes insulin-stimulated skeletal muscle glucose oxidation and storage in noninsulin-dependent diabetes mellitus. J Clin Invest. 1990;86(6):1999–2007. Epub 1990/12/01. doi: 10.1172/JCI114935. [DOI] [PMC free article] [PubMed] [Google Scholar]
- 6.Kelley DE, Simoneau JA. Impaired free fatty acid utilization by skeletal muscle in noninsulin-dependent diabetes mellitus. J Clin Invest. 1994;94(6):2349–56. [DOI] [PMC free article] [PubMed] [Google Scholar]
- 7.Kim JY, Hickner RC, Cortright RL, Dohm GL, Houmard JA. Lipid oxidation is reduced in obese human skeletal muscle. Am J Physiol Endocrinol Metab. 2000;279(5):E1039–44. [DOI] [PubMed] [Google Scholar]
- 8.Ghosh M, Aguila HL, Michaud J, Ai Y, Wu MT, Hemmes A, et al. Essential role of the RNA-binding protein HuR in progenitor cell survival in mice. J Clin Invest. 2009;119(12):3530–43. Epub 2009/11/04. doi: 10.1172/JCI38263. [DOI] [PMC free article] [PubMed] [Google Scholar]
- 9.Ma WJ, Cheng S, Campbell C, Wright A, Furneaux H. Cloning and characterization of HuR, a ubiquitously expressed Elav-like protein. J Biol Chem. 1996;271(14):8144–51. [DOI] [PubMed] [Google Scholar]
- 10.Figueroa A, Cuadrado A, Fan J, Atasoy U, Muscat GE, Munoz-Canoves P, et al. Role of HuR in skeletal myogenesis through coordinate regulation of muscle differentiation genes. Mol Cell Biol. 2003;23(14):4991–5004. [DOI] [PMC free article] [PubMed] [Google Scholar]
- 11.van der Giessen K, Di-Marco S, Clair E, Gallouzi IE. RNAi-mediated HuR depletion leads to the inhibition of muscle cell differentiation. J Biol Chem. 2003;278(47):47119–28. Epub 2003/08/29. doi: 10.1074/jbc.M308889200. [DOI] [PubMed] [Google Scholar]
- 12.Lam YY, Redman LM, Smith SR, Bray GA, Greenway FL, Johannsen D, et al. Determinants of sedentary 24-h energy expenditure: equations for energy prescription and adjustment in a respiratory chamber. Am J Clin Nutr. 2014;99(4):834–42. Epub 2014/02/07. doi: 10.3945/ajcn.113.079566. [DOI] [PMC free article] [PubMed] [Google Scholar]
- 13.Tam CS, Redman LM, Greenway F, LeBlanc KA, Haussmann MG, Ravussin E. Energy Metabolic Adaptation and Cardiometabolic Improvements One Year After Gastric Bypass, Sleeve Gastrectomy, and Gastric Band. J Clin Endocrinol Metab. 2016;101(10):3755–64. Epub 2016/08/05. doi: 10.1210/jc.2016-1814. [DOI] [PMC free article] [PubMed] [Google Scholar]
- 14.Tam CS, Xie W, Johnson WD, Cefalu WT, Redman LM, Ravussin E. Defining insulin resistance from hyperinsulinemic-euglycemic clamps. Diabetes Care. 2012;35(7):1605–10. Epub 2012/04/19. doi: 10.2337/dc11-2339. [DOI] [PMC free article] [PubMed] [Google Scholar]
- 15.Matsumura H, Kruger DH, Kahl G, Terauchi R. SuperSAGE as an analytical tool for host and viral gene expression. Methods Mol Biol. 2015;1236:181–95. Epub 2014/10/08. doi: 10.1007/978-1-4939-1743-3_14. [DOI] [PubMed] [Google Scholar]
- 16.Salbaum JM, Kruger C, MacGowan J, Herion NJ, Burk D, Kappen C. Novel Mode of Defective Neural Tube Closure in the Non-Obese Diabetic (NOD) Mouse Strain. Sci Rep. 2015;5:16917 Epub 2015/11/26. doi: 10.1038/srep16917. [DOI] [PMC free article] [PubMed] [Google Scholar]
- 17.Bothe GW, Haspel JA, Smith CL, Wiener HH, Burden SJ. Selective expression of Cre recombinase in skeletal muscle fibers. Genesis. 2000;26(2):165–6. [PubMed] [Google Scholar]
- 18.Albarado DC, McClaine J, Stephens JM, Mynatt RL, Ye J, Bannon AW, et al. Impaired coordination of nutrient intake and substrate oxidation in melanocortin-4 receptor knockout mice. Endocrinology. 2004;145(1):243–52. Epub 2003/10/11. doi: 10.1210/en.2003-0452. [DOI] [PubMed] [Google Scholar]
- 19.Wicks SE, Londot H, Zhang B, Dowden J, Klopf-Eiermann J, Fisher-Perkins JM, et al. Effect of intrastriatal mesenchymal stromal cell injection on progression of a murine model of Krabbe disease. Behav Brain Res. 2011;225(2):415–25. Epub 2011/08/16. doi: 10.1016/j.bbr.2011.07.051. [DOI] [PMC free article] [PubMed] [Google Scholar]
- 20.Warfel JD, Vandanmagsar B, Wicks SE, Zhang J, Noland RC, Mynatt RL. A low fat diet ameliorates pathology but retains beneficial effects associated with CPT1b knockout in skeletal muscle. PLoS One. 2017;12(12):e0188850 Epub 2017/12/15. doi: 10.1371/journal.pone.0188850. [DOI] [PMC free article] [PubMed] [Google Scholar]
- 21.Wicks SE, Vandanmagsar B, Haynie KR, Fuller SE, Warfel JD, Stephens JM, et al. Impaired mitochondrial fat oxidation induces adaptive remodeling of muscle metabolism. Proc Natl Acad Sci U S A. 2015;112(25):E3300–9. Epub 2015/06/10. doi: 10.1073/pnas.1418560112. [DOI] [PMC free article] [PubMed] [Google Scholar]
- 22.Vandanmagsar B, Haynie KR, Wicks SE, Bermudez EM, Mendoza TM, Ribnicky D, et al. Artemisia dracunculus L. extract ameliorates insulin sensitivity by attenuating inflammatory signalling in human skeletal muscle culture. Diabetes Obes Metab. 2014;16(8):728–38. Epub 2014/02/14. doi: 10.1111/dom.12274. [DOI] [PMC free article] [PubMed] [Google Scholar]
- 23.Noh JH, Kim KM, Abdelmohsen K, Yoon JH, Panda AC, Munk R, et al. HuR and GRSF1 modulate the nuclear export and mitochondrial localization of the lncRNA RMRP. Genes Dev. 2016;30(10):1224–39. Epub 2016/05/21. doi: 10.1101/gad.276022.115. [DOI] [PMC free article] [PubMed] [Google Scholar]
- 24.Vandanmagsar B, Warfel JD, Wicks SE, Ghosh S, Salbaum JM, Burk D, et al. Impaired Mitochondrial Fat Oxidation Induces FGF21 in Muscle. Cell Rep. 2016;15(8):1686–99. Epub 2016/05/18. doi: 10.1016/j.celrep.2016.04.057. [DOI] [PMC free article] [PubMed] [Google Scholar]
- 25.Noland RC, Woodlief TL, Whitfield BR, Manning SM, Evans JR, Dudek RW, et al. Peroxisomal-mitochondrial oxidation in a rodent model of obesity-associated insulin resistance. Am J Physiol Endocrinol Metab. 2007;293(4):E986–E1001. Epub 2007/07/20. doi: 10.1152/ajpendo.00399.2006. [DOI] [PubMed] [Google Scholar]
- 26.Vandanmagsar B, Warfel JD, Wicks SE, Ghosh S, Salbaum M, Burk D, et al. Impaired Mitochondrial Fat Oxidation Induces FGF21 in Muscle. Cell Rep. 2016;15(8):1686–99. doi: 10.1016/j.celrep.2016.04.057. [DOI] [PMC free article] [PubMed] [Google Scholar]
- 27.Covington JD, Noland RC, Hebert RC, Masinter BS, Smith SR, Rustan AC, et al. Perilipin 3 Differentially Regulates Skeletal Muscle Lipid Oxidation in Active, Sedentary, and Type 2 Diabetic Males. J Clin Endocrinol Metab. 2015;100(10):3683–92. Epub 2015/07/15. doi: 10.1210/JC.2014-4125. [DOI] [PMC free article] [PubMed] [Google Scholar]
- 28.Muoio DM, Noland RC, Kovalik JP, Seiler SE, Davies MN, DeBalsi KL, et al. Musclespecific deletion of carnitine acetyltransferase compromises glucose tolerance and metabolic flexibility. Cell Metab. 2012;15(5):764–77. Epub 2012/05/09. doi: 10.1016/j.cmet.2012.04.005. [DOI] [PMC free article] [PubMed] [Google Scholar]
- 29.von Roretz C, Beauchamp P, Di Marco S, Gallouzi IE. HuR and myogenesis: being in the right place at the right time. Biochim Biophys Acta. 2011;1813(9):1663–7. Epub 2011/02/15. doi: 10.1016/j.bbamcr.2011.01.036. [DOI] [PubMed] [Google Scholar]
- 30.Freeman AM, Pennings N. Insulin Resistance. StatPearls; Treasure Island (FL)2018. [Google Scholar]
- 31.Karpe F, Dickmann JR, Frayn KN. Fatty acids, obesity, and insulin resistance: time for a reevaluation. Diabetes. 2011;60(10):2441–9. Epub 2011/09/29. doi: 10.2337/db11-0425. [DOI] [PMC free article] [PubMed] [Google Scholar]
- 32.Laffel L Ketone bodies: a review of physiology, pathophysiology and application of monitoring to diabetes. Diabetes Metab Res Rev. 1999;15(6):412–26. [DOI] [PubMed] [Google Scholar]
- 33.Kelley DE, Mandarino LJ. Fuel selection in human skeletal muscle in insulin resistance: a reexamination. Diabetes. 2000;49(5):677–83. [DOI] [PubMed] [Google Scholar]
- 34.Paukku K, Backlund M, De Boer RA, Kalkkinen N, Kontula KK, Lehtonen JY. Regulation of AT1R expression through HuR by insulin. Nucleic Acids Res. 2012;40(12):5250–61. Epub 2012/03/01. doi: 10.1093/nar/gks170. [DOI] [PMC free article] [PubMed] [Google Scholar]
- 35.Wang W, Fan J, Yang X, Furer-Galban S, Lopez de Silanes I, von Kobbe C, et al. AMPactivated kinase regulates cytoplasmic HuR. Mol Cell Biol. 2002;22(10):3425–36. [DOI] [PMC free article] [PubMed] [Google Scholar]
- 36.Anant S, Houchen CW. HuR and TTP: two RNA binding proteins that deliver message from the 3’ end. Gastroenterology. 2009;136(5):1495–8. Epub 2009/03/31. doi: 10.1053/j.gastro.2009.03.024. [DOI] [PMC free article] [PubMed] [Google Scholar]
- 37.Ricoult SJ, Manning BD. The multifaceted role of mTORC1 in the control of lipid metabolism. EMBO Rep. 2013;14(3):242–51. Epub 2013/02/13. doi: 10.1038/embor.2013.5. [DOI] [PMC free article] [PubMed] [Google Scholar]
- 38.Singh M, Martinez AR, Govindaraju S, Lee BS. HuR inhibits apoptosis by amplifying Akt signaling through a positive feedback loop. J Cell Physiol. 2013;228(1):182–9. Epub 2012/06/08. doi: 10.1002/jcp.24120. [DOI] [PMC free article] [PubMed] [Google Scholar]
- 39.Holmes B, Benavides-Serrato A, Freeman RS, Landon KA, Bashir T, Nishimura RN, et al. mTORC2/AKT/HSF1/HuR constitute a feed-forward loop regulating Rictor expression and tumor growth in glioblastoma. Oncogene. 2017. Epub 2017/10/24. doi: 10.1038/onc.2017.360. [DOI] [PMC free article] [PubMed] [Google Scholar]
- 40.Chavez JA, Knotts TA, Wang LP, Li G, Dobrowsky RT, Florant GL, et al. A role for ceramide, but not diacylglycerol, in the antagonism of insulin signal transduction by saturated fatty acids. J Biol Chem. 2003;278(12):10297–303. Epub 2003/01/15. doi: 10.1074/jbc.M212307200. [DOI] [PubMed] [Google Scholar]
- 41.Holland WL, Brozinick JT, Wang LP, Hawkins ED, Sargent KM, Liu Y, et al. Inhibition of ceramide synthesis ameliorates glucocorticoid-, saturated-fat-, and obesity-induced insulin resistance. Cell Metab. 2007;5(3):167–79. [DOI] [PubMed] [Google Scholar]
- 42.Long SD, Pekala PH. Lipid mediators of insulin resistance: ceramide signalling downregulates GLUT4 gene transcription in 3T3-L1 adipocytes. Biochem J. 1996;319 ( Pt 1):179–84. [DOI] [PMC free article] [PubMed] [Google Scholar]
- 43.Ravichandran LV, Esposito DL, Chen J, Quon MJ. Protein kinase C-zeta phosphorylates insulin receptor substrate-1 and impairs its ability to activate phosphatidylinositol 3-kinase in response to insulin. J Biol Chem. 2001;276(5):3543–9. [DOI] [PubMed] [Google Scholar]
- 44.Ogawa A, Yamamoto S, Kanazawa M, Takayanagi M, Hasegawa S, Kohno Y. Identification of two novel mutations of the carnitine/acylcarnitine translocase (CACT) gene in a patient with CACT deficiency. J Hum Genet. 2000;45(1):52–5. Epub 2000/03/04. doi: 10.1007/s100380050010. [DOI] [PubMed] [Google Scholar]
- 45.Smith BK, Jain SS, Rimbaud S, Dam A, Quadrilatero J, Ventura-Clapier R, et al. FAT/CD36 is located on the outer mitochondrial membrane, upstream of long-chain acyl-CoA synthetase, and regulates palmitate oxidation. The Biochemical journal. 2011;437(1):125–34. Epub 2011/04/06. doi: 10.1042/BJ20101861. [DOI] [PubMed] [Google Scholar]
- 46.van Weeghel M, te Brinke H, van Lenthe H, Kulik W, Minkler PE, Stoll MS, et al. Functional redundancy of mitochondrial enoyl-CoA isomerases in the oxidation of unsaturated fatty acids. Faseb J. 2012;26(10):4316–26. Epub 2012/07/12. doi: 10.1096/fj.12-206326. [DOI] [PubMed] [Google Scholar]
- 47.Gaster M, Rustan AC, Aas V, Beck-Nielsen H. Reduced lipid oxidation in skeletal muscle from type 2 diabetic subjects may be of genetic origin: evidence from cultured myotubes. Diabetes. 2004;53(3):542–8. [DOI] [PubMed] [Google Scholar]
- 48.Ukropcova B, McNeil M, Sereda O, de Jonge L, Xie H, Bray GA, et al. Dynamic changes in fat oxidation in human primary myocytes mirror metabolic characteristics of the donor. J Clin Invest. 2005;115(7):1934–41. Epub 2005/07/12. doi: 10.1172/JCI24332. [DOI] [PMC free article] [PubMed] [Google Scholar]
- 49.Sparks LM, Pasarica M, Sereda O, deJonge L, Thomas S, Loggins H, et al. Effect of adipose tissue on the sexual dimorphism in metabolic flexibility. Metabolism. 2009;58(11):1564–71. Epub 2009/07/15. doi: 10.1016/j.metabol.2009.05.008. [DOI] [PubMed] [Google Scholar]
Associated Data
This section collects any data citations, data availability statements, or supplementary materials included in this article.