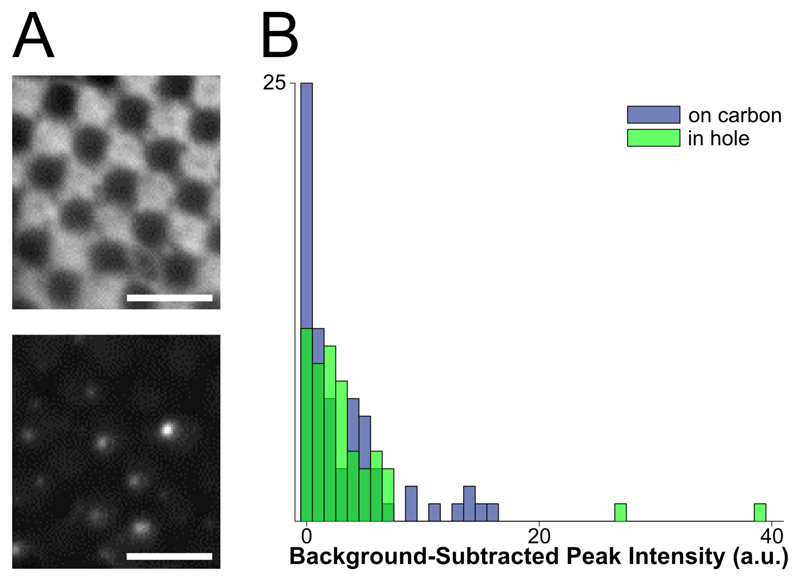
Figure 1. Assessment of fluorophores for labelling vesicles on cryo-EM grids.
A: top: cryo-FM image of POPC vesicles labeled with 4% R18, showing a lawn of fluorescence intensity staining the carbon of the EM grid. Bottom: cryo-FM image of POPC vesicles labeled with 1% DiD, displaying punctate behavior. Scale bars = 5 μm. B: quantification of intensities for clearly separated vesicles labelled with 5% DiD, sorted by location in holes or on carbon.

