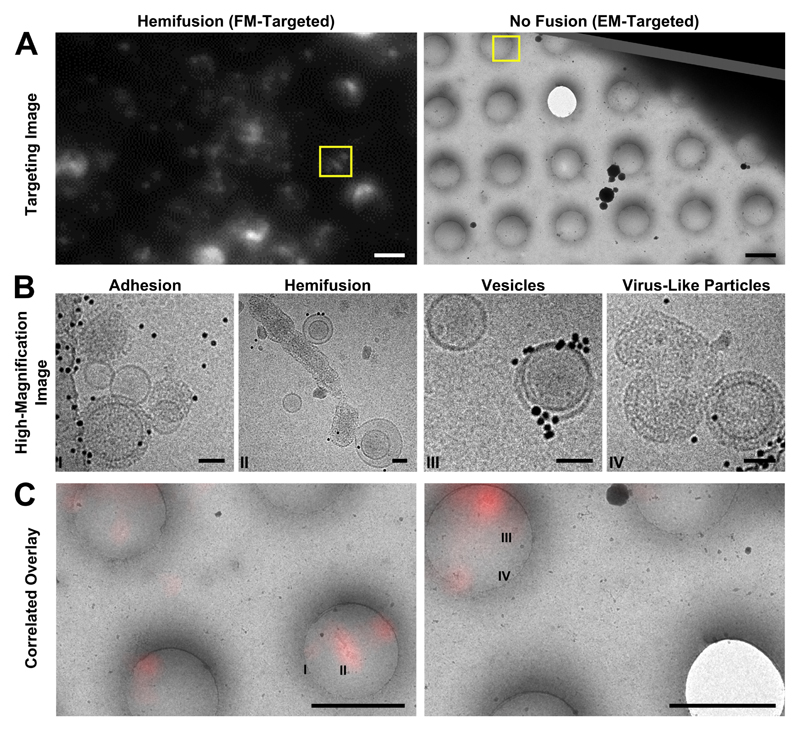
Figure 4. Cryo-CLEM images of different types of on-grid events and their corresponding fluorescence signals.
A: Targeting images are used to define points of interest (yellow boxes). Left: fluorescence-based targeting of potential hemifusion sites. Right: EM-based targeting of VLPs and vesicles irrespective of fluorescence. Scale bars = 2 μm. B: High-magnification micrographs are taken within the targeted areas. Scale bars = 50 nm. C: During post-processing, fluorescence and EM maps are correlated with greater precision, and fluorescence intensities are quantified for all imaging locations. Roman numerals correspond to the high-magnification images in B. Scale bars = 2 μm.

