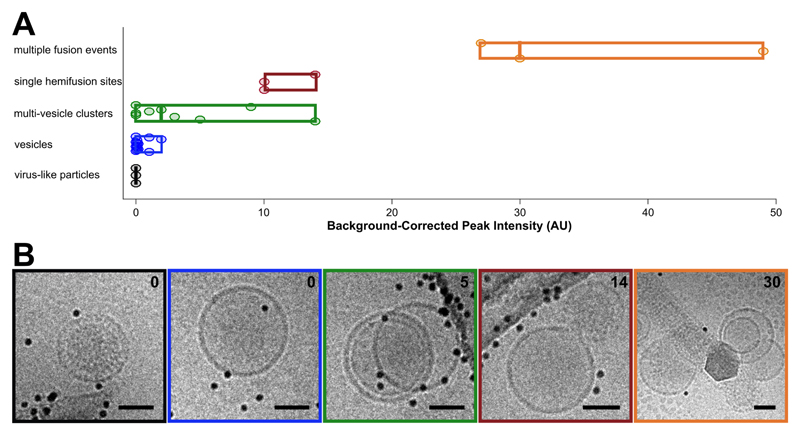
Figure 5. Categorization of events by cryo-CLEM.
A: Fluorescence intensities for vesicles and virus-like particles. Events are classified visually. Circular points are single events, boxes display ranges per category, and mid-lines represent the median value for that category. B: Examples of events for each of the classes in A. Box colors correspond to category colors in A, and baseline-subtracted peak intensities are reported in the upper right hand corner of each image. Scale bars = 50 nm.

