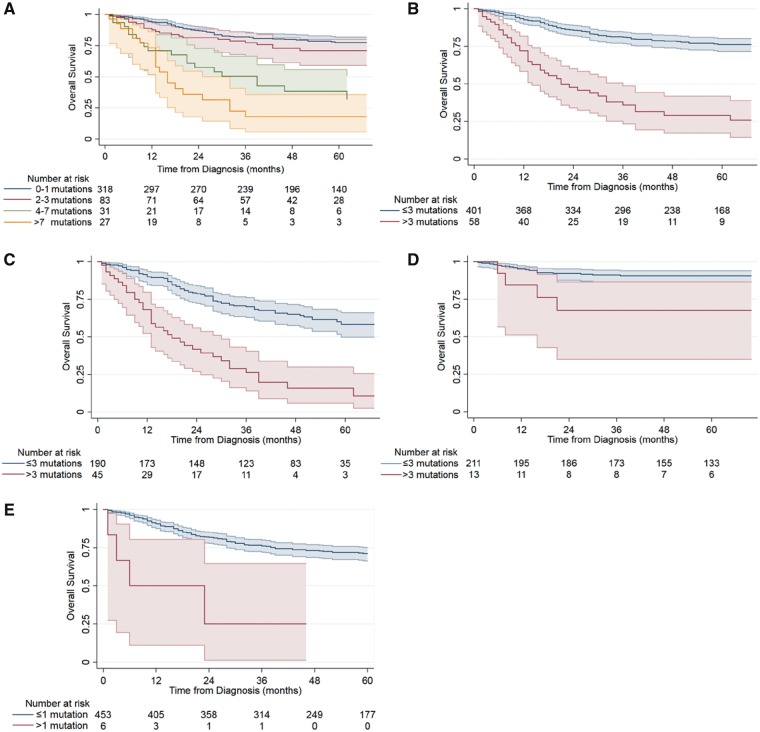
Figure 2.
Association of mutational burden with overall survival in neuroblastoma patients. Kaplan–Meier survival curves stratified by mutation count as a (A) continuous variable grouped for clarity of presentation (n = 459; P < .001), (B) dichotomous variable split at the group mean of three mutations (n = 459; P < .001), (C) dichotomous variable in high-risk patients defined as 18 months of age or older with International Neuroblastoma Staging System stage 4 disease (n = 235; P < .001), (D) dichotomous variable in non-high-risk patients (n = 224; P = .006), (E) dichotomous variable only using data from 447 genes included in OncoPanel (n = 459; P < .001). 95% confidence intervals are shown and risk tables are below each plot. A two-sided log-rank test was used to calculate the P values.

