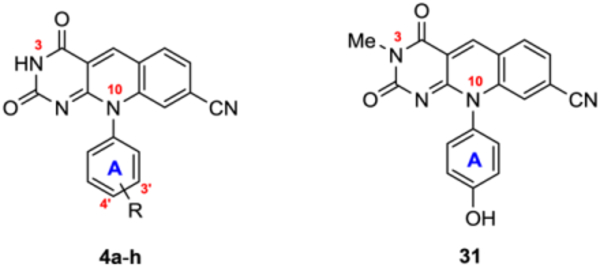
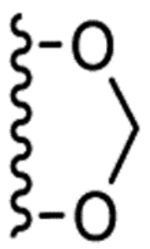
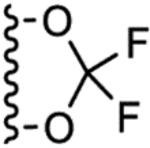
Table 1.
TDP2 inhibitory activity and PAMPA permeability for the control series.
 | |||
|---|---|---|---|
| Compd | R | TDP2 IC50 (μM)a | PAMPA Pe (10−6 cm/s)b |
| 4ac |  |
0.041 ± 0.003 | 0.003 |
| 4bc | 3′ OH | 0.042 ± 0.004 | 0.01 |
| 4cc | 4′ OH | 0.14 ± 0.01 | 0.008 |
| 4dc | H | 0.64 ± 0.02 | 0.4 |
| 4e | 4′ OCF3 | 1.0 ± 0.1 | 1.1 |
| 4f | 4′ OCHF2 | 0.88 ± 0.06 | 0.3 |
| 4g |  |
0.96 ± 0.02 | 0.5 |
| 4h |  |
1.5 ± 0.1 | 1.1 |
| 31 | -- | 0.32 ± 0.02 | 0.1 |
IC50: concentration of a compound producing 50% inhibition, expressed as mean ± standard deviation from three independent experiments performed in triplicate.
Pe: effective permeability coefficients determined using the PAMPA, measured in five replicates.
Previously reported analogues. Reported IC50 values are 0.04 μM (4a), 0.05 μM (4b), 0.09 μM (4c) and 0.50 μM (4d).15
