
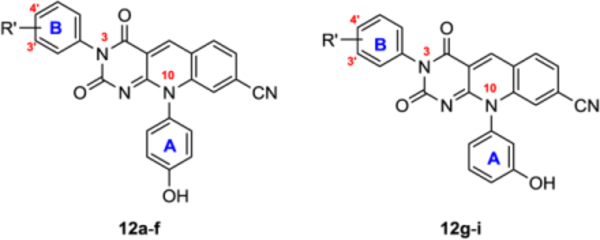
Table 3.
TDP2 inhibitory activity and PAMPA permeability for analogues from N-3 modifications (12a-i).
 | |||
|---|---|---|---|
| Compd | R′ | TDP2 IC50 (μM)a | PAMPA Pe (10−6 cm/s)b |
| 4c | -- | 0.14 ± 0.01 | 0.008 |
| 12a | H | 0.033 ± 0.001 | 0.1 |
| 12b | 4′ Cl | 0.033 ± 0.002 | 0.08 |
| 12c | 4′ F | 0.070 ± 0.003 | 0.06 |
| 12d | 4′ Br | 0.065 ± 0.003 | 0.05 |
| 12e | 3′ CO2Me | 0.038 ± 0.003 | 0.03 |
| 12f | 3′ CONH2 | 0.035 ± 0.000 | 0.01 |
| 4b | -- | 0.042 ± 0.004 | 0.01 |
| 12g | 4′ Cl | 0.0073 ± 0.0003 | 0.04 |
| 12h | 3′ Cl | 0.020 ± 0.002 | 0.07 |
| 12i | 3′, 4′ di-Cl | 0.014 ± 0.000 | 0.03 |
a
IC50: concentration of a compound producing 50% inhibition, expressed as mean ± standard deviation from three independent experiments performed in triplicate.
b
Pe: effective permeability coefficients determined using the PAMPA, measured in five replicates.