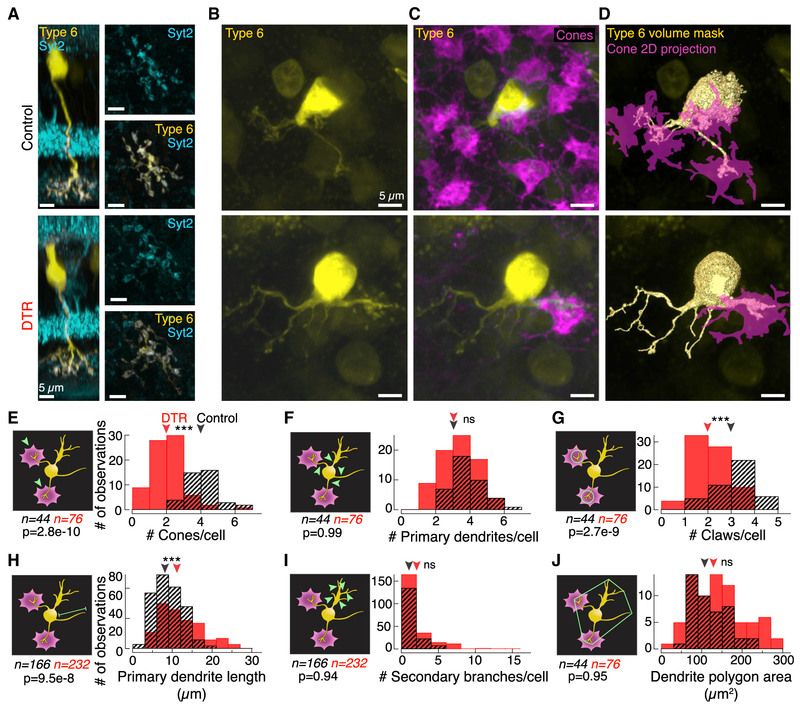
Figure 2. At the First-Order Synapse, Postsynaptic Type 6 Cone Bipolar Cell Dendrites Remodel after Cone Loss in Mature Retina.
(A) Confocal images of type 6 cone bipolar cells labeled in the transgenic Grm6-TdTomato line. Side views of the isolated type 6 bipolar cells with Syt2 labeling of the type 2 and 6 bipolar cell axons. (Right) En face views of the bipolar cell axon terminal showing overlap with Syt2 within the axon in control (top) and DTR (bottom) retina.
(B and C) En face views of the type 6 cone bipolar cell (B) dendrites alone and (C) with cone pedicles labeled by cone arrestin in control (top) and DTR (bottom) retina.
(D) Rendered images of the type 6 bipolar cell dendrites (yellow) and associated cone pedicles (magenta). Such binary images of the bipolar cell dendrites and cones were used to determine volume overlap between the two structures.
(E–J) Histograms of (E) the number of cones that each type 6 bipolar cell contacts as determined by nonzero volume overlap between bipolar cell dendrites and cones; (F)the number of primary dendrites branching directly off the bipolar cell soma; (G)the number of claws per bipolar cell, defined by >3 secondary branches within a 10-μm-diameter circle; (H)the length of primary dendrites from the soma to the longest dendritic tip; (I) the number of second-order and greater branches coming from a primary branch that are not part of a claw structure; (J) the area of the polygon drawn around the vertices of the dendritic tips. Arrowheads point to median. Asterisks indicate significance (see Results). Measurement examined is indicated on the schematic in green (left of each histogram). In the control condition, claws were seldom found without a cone contact. In the DTR condition, claws existed at terminals both with and without a cone contact. We cannot distinguish whether the claws in the absence of cones linger from previous cone contacts or are newly formed claws. Data combined across time points because there was no significant difference between shortest and longest time points (see Results). Number of samples (n) and p value for rank sum test noted in each panel.

