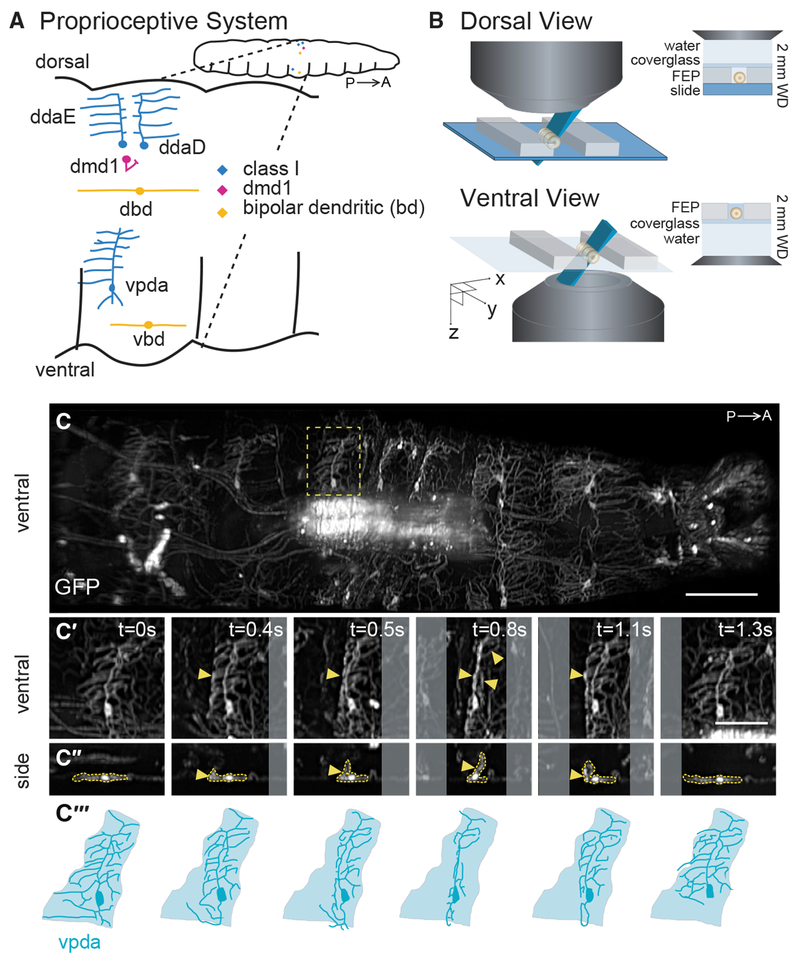
Figure 1. SCAPE Imaging of Proprioceptor Dendrite Motion Dynamics in Crawling Larvae.
(A) Schematic of the larval proprioceptive system. P, posterior; A, anterior.
(B) Schematic of the larval imaging platform for SCAPE microscopy (see STAR Methods).
(C) SCAPE imaging of a 221-Gal4, UAS-CD4tdGFP larva ventral side during crawling. Maximum-intensity projection (MIP) over a 95-μm-depth range from a 160-μm-deep volume (to exclude gut auto-fluorescence, square root grayscale; see STAR Methods). See Video S1. The yellow box indicates the neuron examined in (C′)–(C‴).
(C′ and C″) vpda in ventral view (C′) and side view (C″) in successive time-lapse frames during forward crawling. vpda dendritic arbors and cell body are outlined in yellow. Other arbors are from class IV neurons.
(C‴) Tracing of neurons in (C′). Shaded areas represent dendritic field territory before folding.
Posterior is to the left for all images. Scale bars, 100 μm (C) and 50 μm (C′ and C″).

