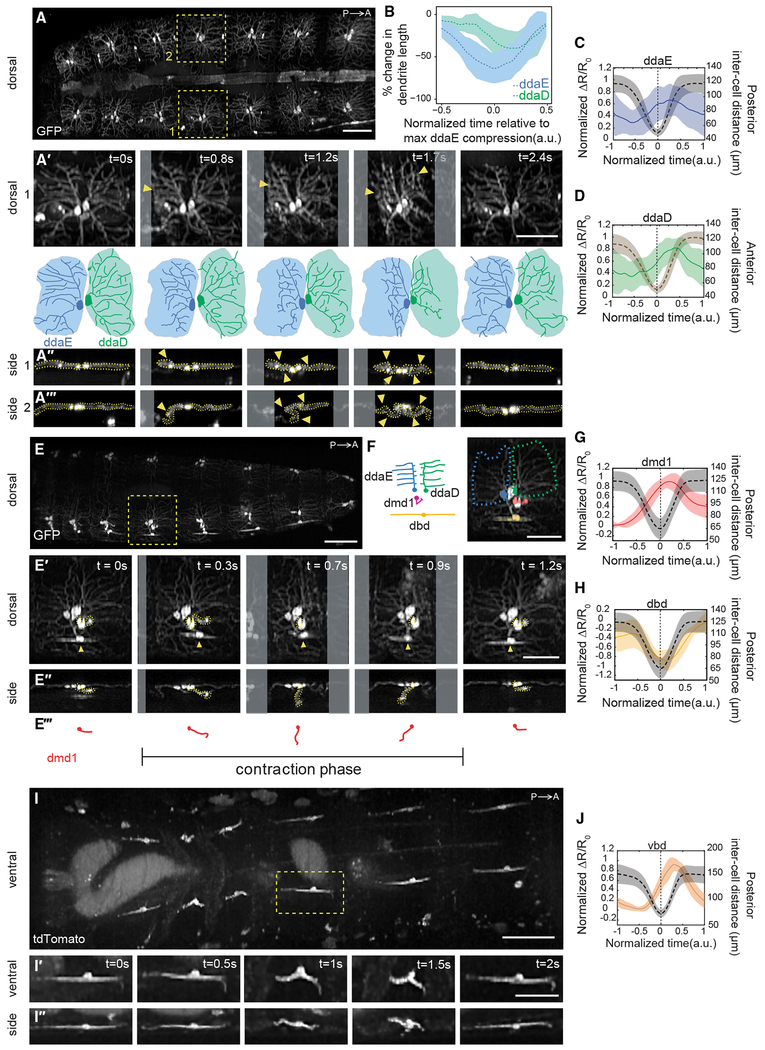
Figure 3. Proprioceptors with Diverse Morphologies Show Distinct Activity Patterns during Forward Crawling.
(A) Single frame from a SCAPE movie of a larva during crawling with ddaD and ddaE neurons visible on the dorsal side. Neurons were labeled using 221-Gal4, UAS-CD4tdGFP. Yellow boxes indicate neurons examined in the time-lapse sequences below.
(A′) Top: enlarged dorsal view of right-side neurons (1). Arrowheads indicate regions of dendrite folding. Bottom: tracing of neurons (top). Shaded areas represent dendritic field territory before folding.
(A″ and A‴) Side view of right-side neuron (1) (A″) and left-side neuron (2) (A‴) during segment contraction. Arrowheads indicate dendritic folding.
(B) Mean (± SD) percent change in dendritic length along the anteroposterior axis (a measure of dendritic folding) of ddaD (green; n = 10 cells) and ddaE (blue; n = 10 cells) from 221-Gal4, UAS-CD4tdGFP (2 animals) and 410-Gal4, UAS-CD4tdtomato (2 animals) during forward crawling. (See Figure S3 for changes to dendrite folding and activity in compressed conditions.)
(C and D) Mean (± SD) calcium response (solid line) of ddaE (C) and ddaD (D) soma during segment contraction (quantified as the fractional change in the GCaMP/tdTomato fluorescence ratio ΔR/R0; see STAR Methods). Mean (± SD) inter-cell distance is plotted with a dashed line. Maximal contraction is set at t = 0 s for each event. In (D), we plotted anterior inter-cell distance between the measured neuron and the homologous neuron in the anterior segment, because this was a better proxy for ddaD dendrite folding. To compare neurons in animals crawling at different speeds, the time window and the amplitude of each trace were normalized and interpolated across events (see STAR Methods).
(E) SCAPE imaging of a GMR10D05-Gal4, UAS-CD4tdGFP larva during crawling showing dorsal cluster dendrite dynamics. Yellow box indicates neurons examined in the time-lapse sequences below.
(E′-E‴) Dorsal (E′) and side (E″) views in which dmd1 soma and dendrite bundle are traced with a dashed yellow line; tracing is shown in (E‴). dbd is noted with an arrowhead.
(F) Schematic and inset image showing neurons imaged together in (E). Inset: pseudo-colored neurons; ddaE (blue), ddaD (green), dbd (yellow), and dmd1 (pink). The dashed line represents the outline of ddaE and ddaD dendritic fields.
(G and H) Mean (± SD) calcium response (solid line) of dmd1 (G) and dbd (H) soma during segment contraction (quantification and representation are the same as in C above).
(I–I″) SCAPE imaging of a 1129-Gal4, 20XUAS-IVS-GCaMP6f (×2), UAS-CD4-tdTomato larva ventral side during crawling. The yellow box indicates the vbd neuron examined in (I′) and (I‴) ventral and side views.
(J) Mean (± SD) calcium response (solid line) of vbd soma during segment contraction (quantification and representation are the same as in C above).
For (A), (E), and (I), images show representative SCAPE MIPs over an 80- to 95-μm-depth range from a 160- to 165-μm-deep volume (to exclude gut auto-fluorescence; square root grayscale). See Video S4 for dendrite motion dynamics and Video S5 for GCaMP dynamics related to (A), (E), and (I). Sample sizes:(c) 3 animals, n = 10 cells, 17 events; (D) 3 animals, n = 7 cells, 11 events; (G and H) n = 4 animals, n = 8 cells, 16 events; (J) n = 4 animals, n = 14 cells, 14 events. Figure S2 shows GCaMP and tdTomato images and single-neuron GCaMP activity from all genotypes. All ribbons represent SD. Posterior is to the left for all images. Scale bars, 100 μm (A, E, and I) and 50 μm (A′, A″, E′, E″, F, I′, and I″).

