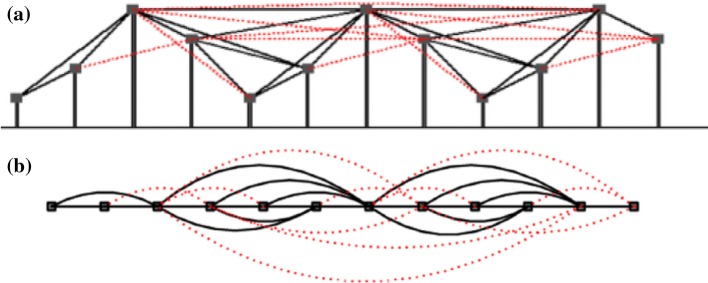
Fig. 3.
Illustrates the procedure of converting time series to the LPVG (N = 1). a Time series: each black line shows the two connected points can see each other. The red lines are extra connections in LPVG compared with VG. b Corresponding graph: The LPVG consists of red and black links and the NVG consists only of black links (Pei et al. 2014). (Color figure online)

