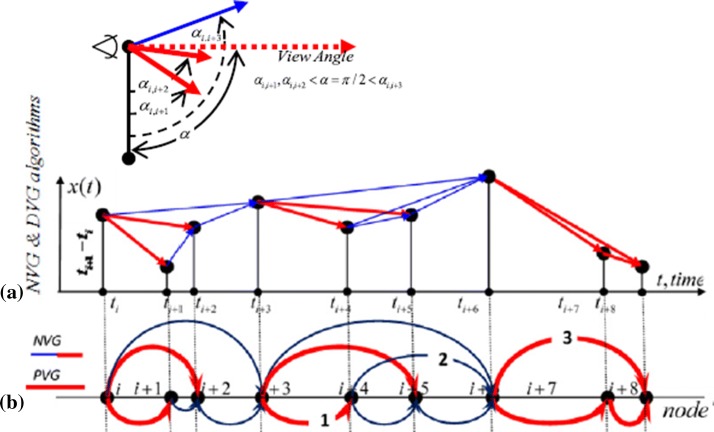
Fig. 4.
The Illustration of the PNVG algorithm. a Time series plot for NVG and PNVG algorithms, b corresponding graphs, The NVG consists of red and blue links. The PNVG (π/2) consists only of red links. Upper left—the PNVG link selection criterion for view angle α = π/2 applied to nodes () (Bezsudnov and Snarskii 2014). (Color figure online)

