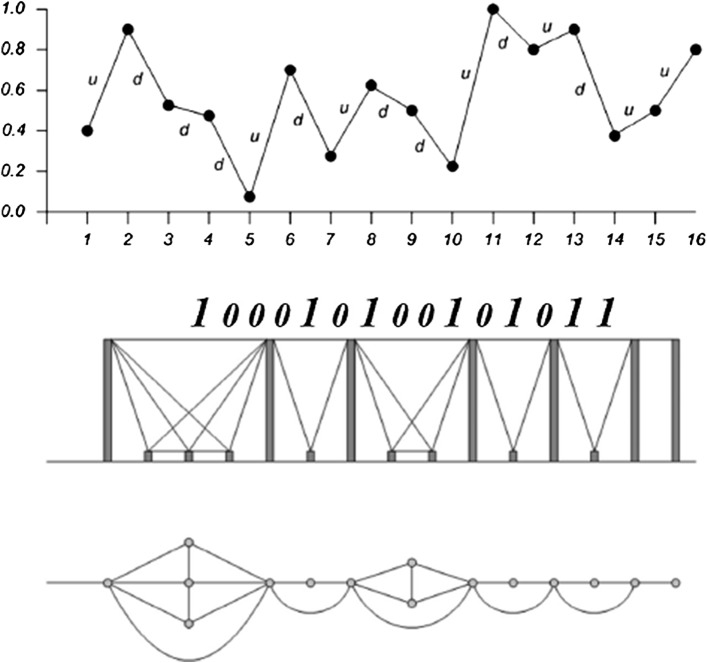
Fig. 5.
An example of the Markov-binary visibility graph construction. The upper part shows time series and intermediate part shows the Markov binary sequence generated from time series. The bottom part represents the graph generated through the visibility algorithm (Ahadpour et al. 2014)

