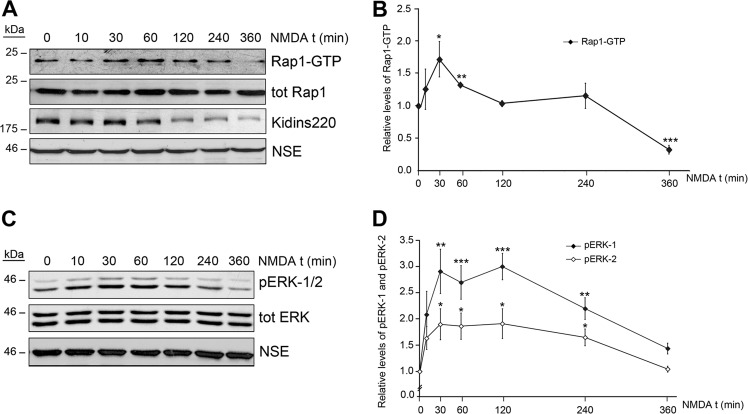
Fig. 5. NMDAR overstimulation induces a transient activation of Rap1 and ERK.
a Rap1 activation curve in response to NMDAR-overstimulation was determined after pulling down active Rap1-GTP with GST-Ral-GDS and immunoblot analysis. b The amount of active Rap1-GTP in the pull-down was normalized to total Rap levels present in the lysates and represented relative to the value obtained in nonstimulated cells, arbitrary assigned a value of 1. Results shown are the means ± s.e.m. of five independent experiments. c ERK activation was measured by immunoblot analysis of neuronal cultures stimulated with NMDA for various periods of time. d Quantitation of phospho-ERK-1 (pERK-1) and phospho-ERK-2 (pERK-2) levels with time of NMDA treatment normalized to those of total ERK. Values are expressed relative to those found in untreated cells, arbitrary assigned a value of 1. Data represented are the means ± s.e.m. of five independent experiments. *p < 0.05, **p < 0.01 and ***p < 0.001, Student’s t-test

