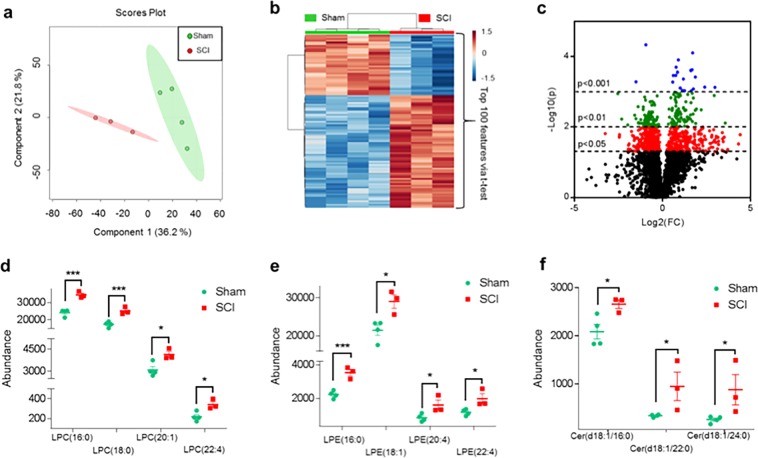
Fig. 3. SCI alters lysosomal membrane lipid composition.
Results of LC-MS/MS lipid analysis of purified lysosomes from SCI and sham spinal cord membranes at 2 h after injury. a Partial Least Squares-Discriminate Analysis (PLS-DA) plot comparing sham (green) and SCI (red) in positive ion mode UPLC-HDMSE demonstrating separation of sham and SCI data; R2 = 0.88, Q2 = 0.51. Each point represents a data set from an individual animal. The 95% confidence intervals are indicated by elliptical patterns per group. Data were sum normalized, log transformed, and mean centered. b Heatmap displaying the top 100 differential abundance features based on t-test/ANOVA, Euclidean distancing and Ward clustering in positive ion mode UPLC-HDMSE. c Volcano plot highlighting features that had a *p < 0.05 (red), **p < 0.01 (green), and ***p < 0.001 (blue) when comparing Sham to SCI. The x-axis is log2(FC) (FC = fold change) and the y-axis is –log10(p) (p = p-value based on t-test). Plots in a–c generated using MetaboAnalyst; n = 4 for sham and n = 3 for SCI. d–f Altered abundance of specific lipid classes in lysosomal membranes from sham (green) and SCI (red) mice. Statistical significance was determined using t-test. d LPC (lysophosphatidylcholine) abundance. Calculated p-values were 0.0015 (LPC(16:0)), 0.0029 (LPC(18:0)), 0.0246 (LPC(20:1)), and 0.0207 (LPC(22:4)). e LPE (lysophosphatidylethanolamine) abundance. Calculated p-values were 0.0019 (LPE(16:0)), 0.0239 (LPE(18:1)), 0.0301 (LPE(20:4)), and 0.0196 (LPE(22:4)). f Cer (ceramide) abundance. Calculated p-values were 0.0395 (Cer(d18:/16:0)), 0.0240 (Cer(d18:/22:0)), and 0.0247 (Cer(d18:/24:0)). Individual data points and mean ± SEM are indicated. n = 4 for sham and n = 3 for SCI

