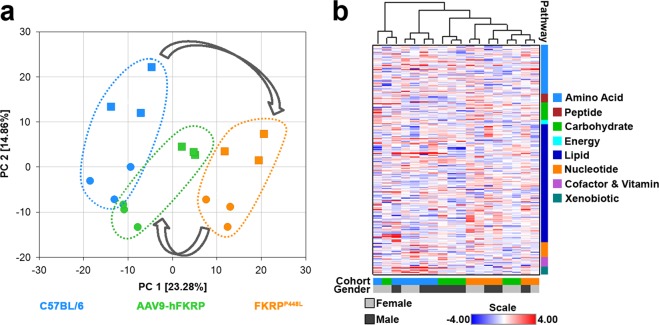
Figure 1.
Metabolomic analysis of diseased, treated, and normal skeletal muscle. (a) A principal component analysis (PCA) plot and (b) a heatmap depicting hierarchical clustering analysis (HCA) from quadriceps muscles derived from 52-week old C57BL/6, AAV9-hFKRP-treated, and untreated FKRPP448L mice were calculated using the Euclidian distance metrics. In the PCA plot, male and female subjects are identified by circles and squares, respectively. In both plots, C57BL/6 samples are identified by blue symbols, AAV9-hFKRP-treated samples by green symbols, and untreated FKRPP448L samples by orange symbols.

