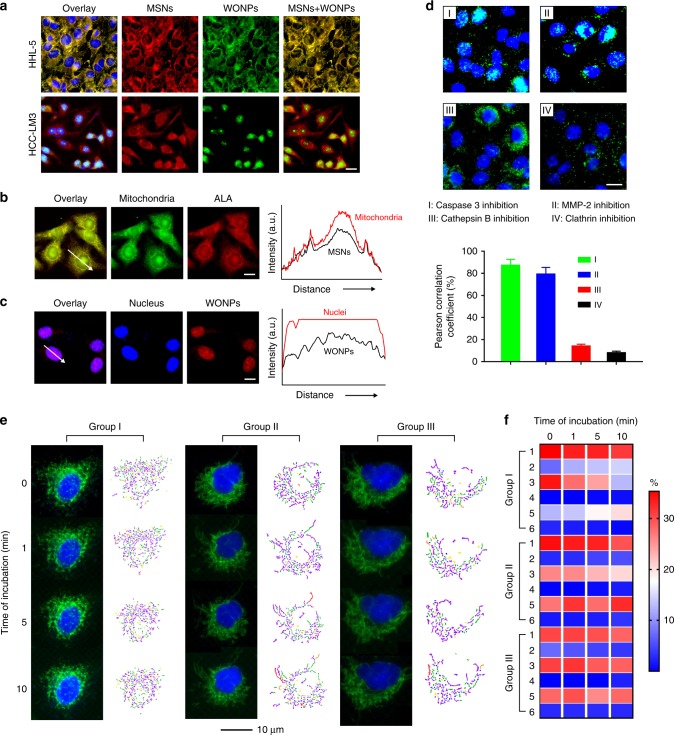
Fig. 3.
In vitro cellular uptake and targeting. a The fluorescence micrographs of HHL-5 (hepatocyte) and HCT-116 (cancer cell) cells post incubation with Mito(T)-pep-Nuc(T)(Alex Fluor-488-labeled) for 4 h. The nuclei of the cells were stained with Hoechst after the incubation with nanoparticles. Scale bar: 10 μm. b, c Correlation of b Mito(T)-pep-Nuc(T)(no labeling) with mitochondria (stained with Mitotracker Green) and c Mito(T)(no payload)-pep-Nuc(T)(dye-labeled) and nuclei (stained with Hoechst) post a 4 h incubation with HCT-116 cells. Their fluorescence intensity profiles were measured using Fiji (Image J) and shown as a function of distance on the right. d the correlation of dye-labeled Nuc(T) with nuclei post a 4 h incubation of Mito(T)-pep-Nuc(T) with HCT-116 cells whose activity of Caspase 3, MMP-2, Cathepsin B, or Clathrin was blocked. Scale bar: 10 μm. The Pearson correlation analyses of the fluorescence micrographs were shown at the bottom (data are presented as mean ± s.e.m., n = 4). e In situ time-lapse fluorescence study of the changes in mitochondrial morphology during laser irradiation (633 nm, 1 W cm−2). The HCT-116 cells were pre-incubated with Mito(T)-pep-Nuc(T). The observation was conducted in triplicate as denoted by Group I–III, with the microstructures of mitochondria analyzed using MicroP software, including six classes of mitochondria as detailed in the captions (I–VI). f The populations of six phenotype mitochondria as a function of the duration of laser irradiation. A color bar on the right indicates the color scales. P values were calculated using one-Way ANOVA (***p < 0.001)

