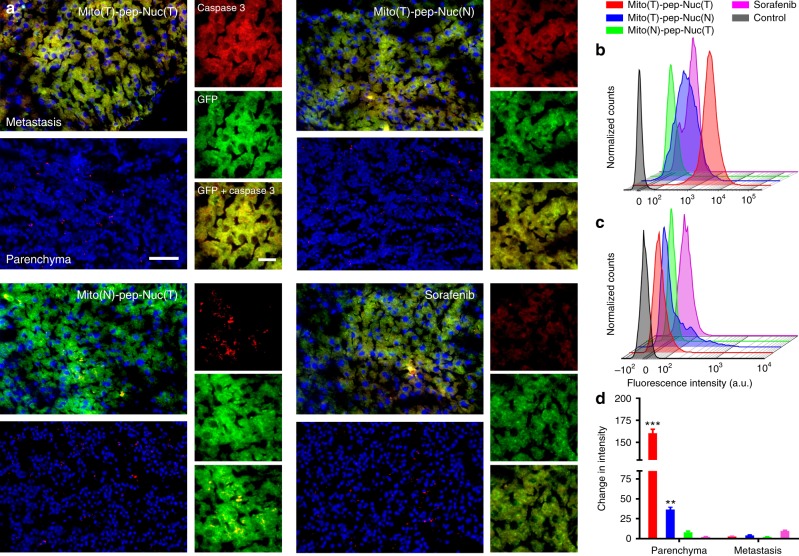
Fig. 6.
Apoptosis profiles of liver metastatic lesion and parenchyma. a Immunofluorescence micrographs showing the expression of active Caspase 3 (labeled in red) in both metastasis (GFP positive, green) and pan-cancer, normal parenchyma (GFP negative). Scale bars: 80 μm (left) and 20 μm (right). b, c Flow-cytometry results showing the intracellular cleaved-PARP expression. The freshly harvested liver tissues from mice received different treatments were digested and sorted using flow-cytometry on the basis of the expression of the GFP protein, sequentially followed by fixation, permeabilization, and staining with phycoerythrin (PE)-labeled cleaved-PARP antibody. d Changes of cleaved-PARP expression in b metastasis and c liver parenchyma. The averaged value of three independent tests was normalized to that of the control group; data are presented as mean ± s.e.m. (n = 3). P values were calculated by one-way ANOVA (***p < 0.001, **p < 0.005)

