Fig. 7.
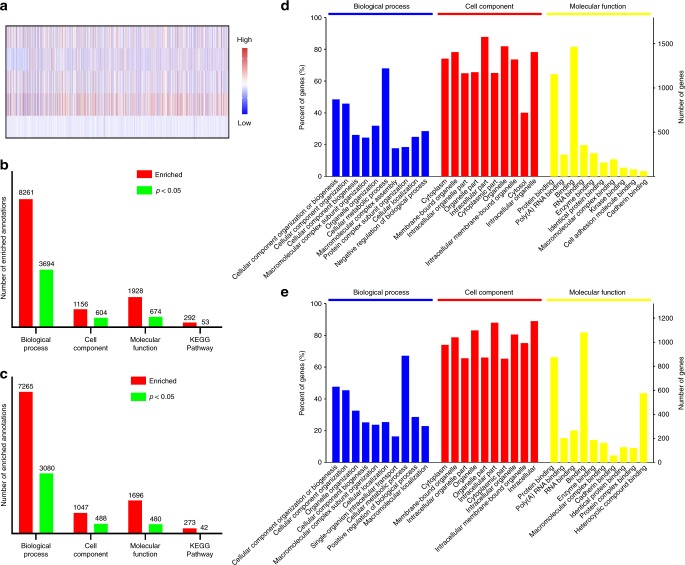
Changes in gene expression. a A heat map showing the expression levels of 5542 identified genes in liver metastasis lesions of mice received different treatments. Treatments (from top to bottom row): Mito(T)-pep-Nuc(T), Mito(T)-pep-Nuc(N), Mito(N)-pep-Nuc(T), Sorafenib, and PBS. b, c Charts showing the total number of enriched annotations for b up-regulated and c down-regulated genes whose differences in expression are of statistical significance. Four categories, including biological process, cellular components, molecular function, and KEGG pathway, were considered. d, e Top-10 significantly enriched GO annotations associated with d up-regulated and e down-regulated genes belonging to the term of Biological Process, Cell Component, and Molecular Function

