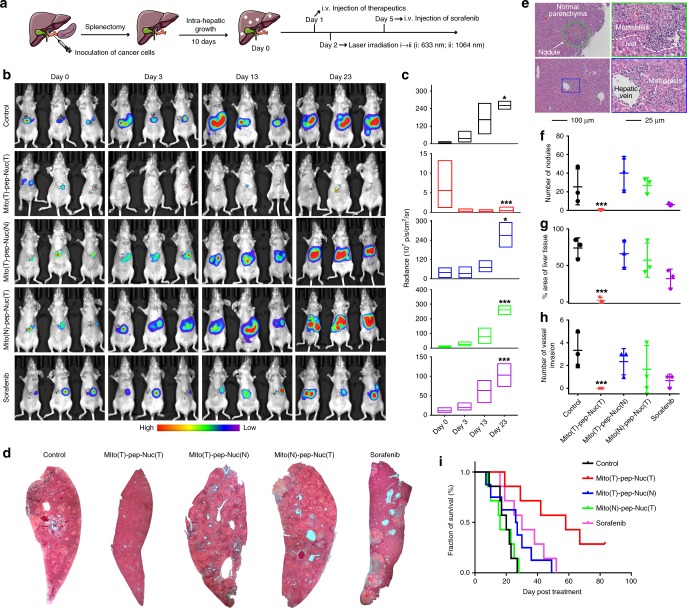
Fig. 9.
In vivo anti-metastasis effect. a A schematic showing the procedures of in vivo experiments (n = 7 in each group). b Bioluminescence graphs of mice at different time points after receiving the treatments with the radiance of liver tissues quantified and shown in c (n = 3). In the box plot, the upper and lower quartile as outlined by top and bottom boundary were divided by line showing the median value. d Necropsy of representative liver tissues collected at day 30 or the day they died if earlier than day 30. (A full spectrum of necropsy is shown in Supplementary Figs. 26–30). e Representative micrographs with H&E staining showing the pathological features of liver metastasis and pan-cancer normal parenchyma. The micrographs on the right panel show the details of regions that have been highlighted with either the green circle or blue box at a higher magnification. f Number of nodules that existed in an observation area (×10, average of ten fields for each mouse). g Area of the liver tissue that was occupied by metastasis. h The number of cases of invasion into liver vessels (n = 3). Median value was shown as line in the middle of the plot. i Survival profiles of mice received different treatments during an observation period of 80 days (n = 7). Data are presented as mean ± s.e.m. P values were calculated by one-way ANOVA (***p < 0.005, *p < 0.05)

