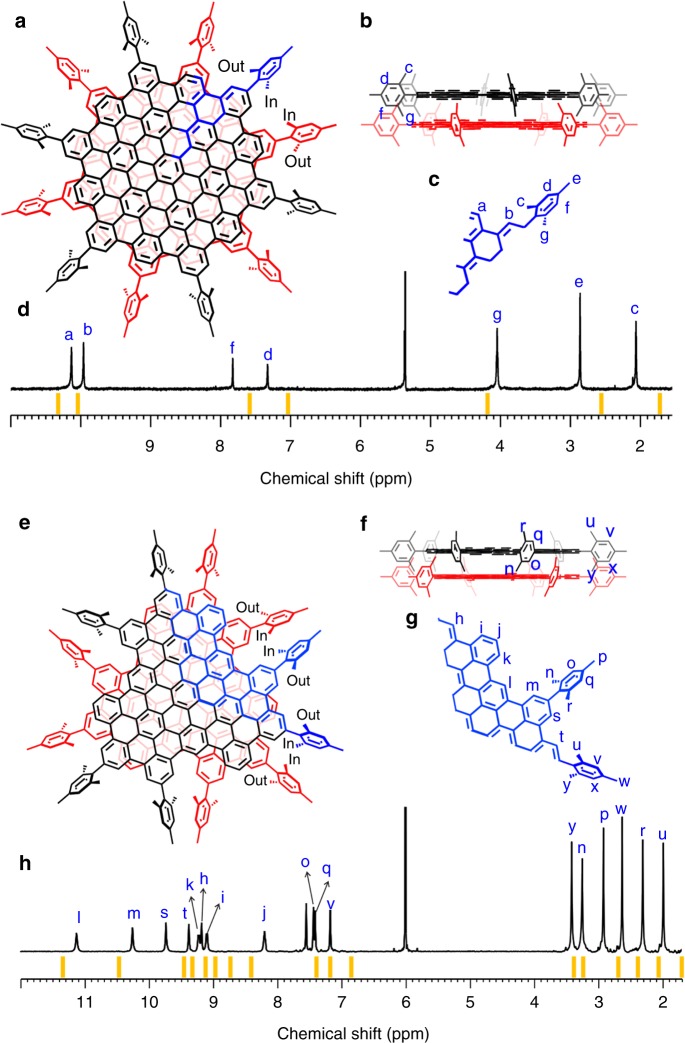
Fig. 2.
Nuclear magnetic resonance (NMR) characterization of molecular bilayer graphene. a, e The top views of 1 and 2, respectively. The asymmetric units in 1 and 2 are highlighted in blue. In and out represents the inward-spacing and outward-spacing methyl of the mesityl group. b, f The side views of 1 and 2. c, g Numeration of hydrogen atoms in the asymmetric units of 1 and 2, respectively. d, h 1H NMR spectra of 1 and 2. The theoretical NMR spectra of 1 and 2 are represented as orange lines. All of the proton resonances are assigned with the assistance of two-dimensional NMR spectroscopy (Supplementary Figs. 21–32 and Supplementary Note 2)

