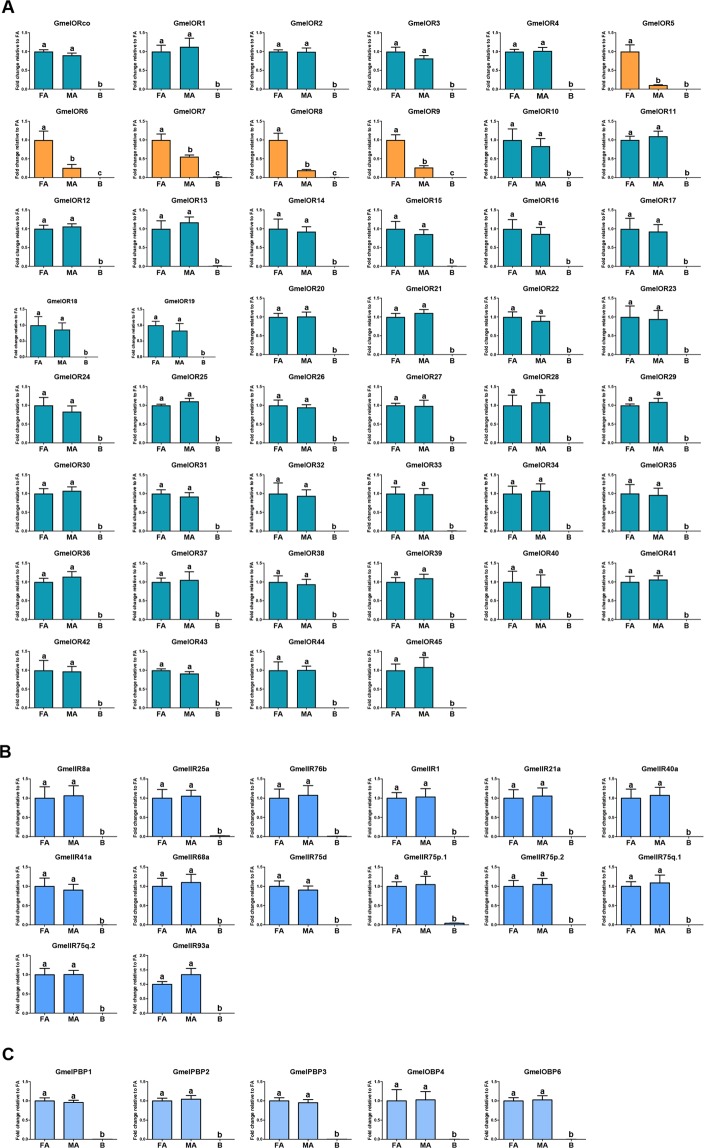
Figure 7.
Relative expression levels of all ORs (A), antennal IRs (B) and the antenna-enriched OBPs (C) in the female and male antennae, and other body parts. Abbreviations: FA, female antennae, MA, female antennae, B, other body parts (the pooled tissue mixture of mouthparts, forelegs, wings, female ovipositor-pheromone glands, and male external genitalia). Highlighted histograms: the female-biased ORs (GmelOR6-9) (orange). The expression levels were estimated using the 2−ΔΔCT method. The relative expression level is indicated as mean ± SE (n = 3). Standard error is represented by the error bar, and different letters indicate statistically significant difference between tissues (p < 0.05, ANOVA, HSD).

