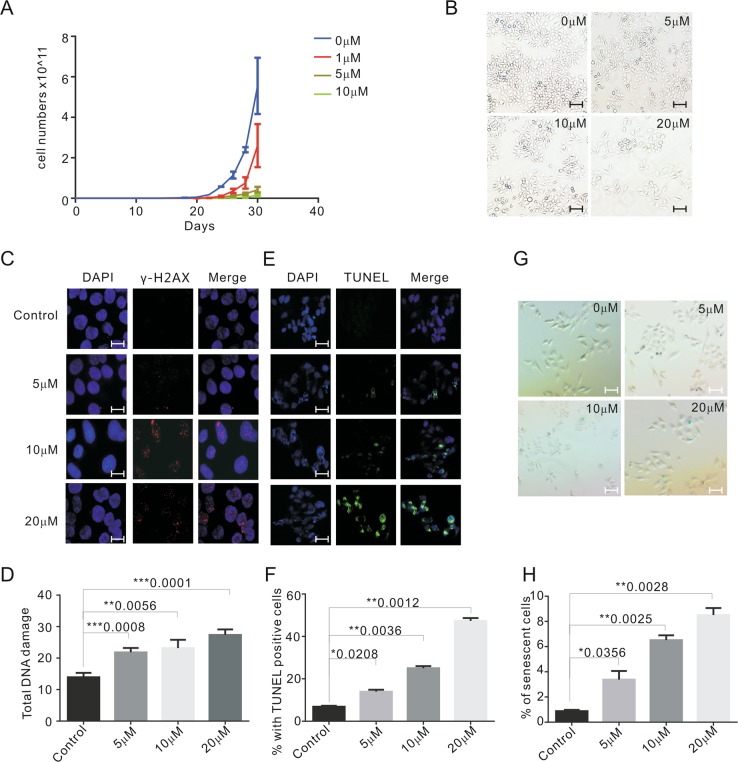
Fig. 2. Emodin inhibits cell growth and leads to DNA damage in HeLa cells.
a Growth curve of HeLa cells treated with DMSO and 1, 5, and 10 μM emodin for 30 days. b Morphology of HeLa cells treated with various concentrations of emodin for 48 h. Scale bars are 50 μm. c Representative images showing the detection of γ-H2AX for the control (DMSO) and emodin-treated HeLa cells (5, 10, and 20 μM for 48 h). γ-H2AX (red), nuclei (blue). Scale bars are 10 μm. d The graph of the number of DNA-damage foci for c. e Representative images showing apoptotic cells detected by TUNEL. TUNEL positive cells labeled as green. Cells were treated with DMSO, 5, 10, and 20 μM emodin for 48 h. Scale bars are 20 μm. f The graph of e. g Cells were treated with DMSO and 5, 10, and 20 μM emodin in for 48 h, then sensecense cells were detected by SA-β-gal staining. SA-β-gal-positive cells were stained in blue. Scale bars are 20 μm. h The percentage of senescent cells with different treatment. Data are shown as mean ± SD. n = 3

