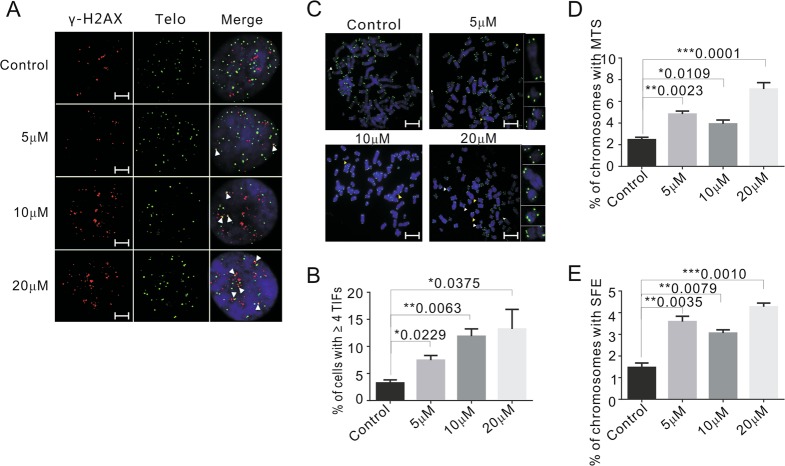
Fig. 3. Emodin induces telomere-specific DNA damage and dysfunction.
a Immunolocalization of γ-H2AX (red) and FISH of telomere (green) in HeLa cells grown with or without emodin for 48 h. White arrows indicate TIFs (sites of γ-H2AX with telomeres). Scale bars are 2 μm. b The percentage of cells with ≥4 TIFs was determined for at least 50 cells in each experiment. c Telomere FISH with HeLa cells treated with indicate amount of emodin for 48 h. White arrows indicate MTS and yellow arrows indicate SFE. Scale bars are 5 μm. d, e Percentage of chromosomes with MTS and SFE. More than 1000 chromosomes were analyzed in each experiment. Data are shown as mean ± SD. n = 3

