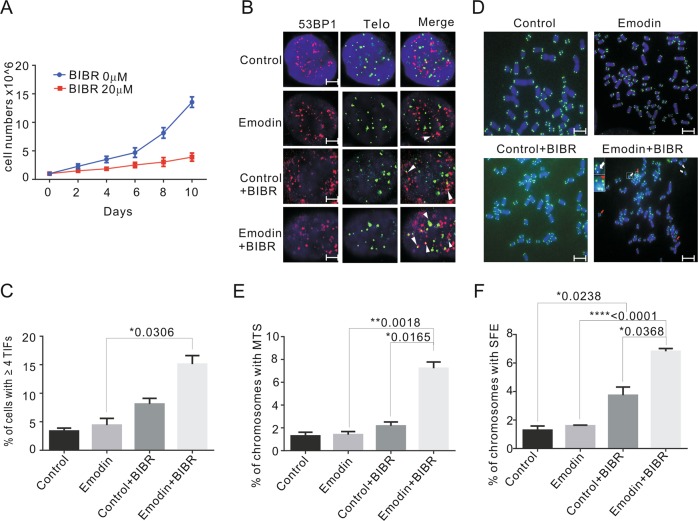
Fig. 6. Emodin-induced telomere damage and dysfunction cann’t be rescued when telomerase activity gets inhibited.
a Growth curve of HeLa cells treated with 5 μM emodin and 0 μM or 20 μM telomerase inhibitor BIBR1532 for 10 days. b Immunolocalization of 53BP1 (green) and FISH of telomere (red) in HeLa cells. Control (DMSO for 10 days), emodin group (5 μM for 10 days), BIBR group (DMSO for 48 h, then 20 μM BIBR1532 was added for additional 8 days), emodin and BIBR group (emodin 5 μM for 48 h, then 20 μM BIBR1532 was added for additional 8 days). White arrows indicate TIFs (sites of 53BP1 with telomeres). Scale bars are 2 μm. c The percentage of cells with ≥4 TIFs was determined for at least 50 cells in each experiment. d Representative images of metaphase telomere FISH. Control (DMSO for 10 days), emodin group (5 μM for 10 days), BIBR group (DMSO for 48 h, then 20 μM BIBR1532 was added for additional 8 days), emodin and BIBR group (emodin 5 μM for 48 h, then 20 μM BIBR1532 was added for additional 8 days). White arrows indicate SFE and red arrows indicate MTS. Scale bars are 5 μm. e, f Percentage of chromosomes with MTS and SFE with different treatment. Data are shown as mean ± SD. n = 3

