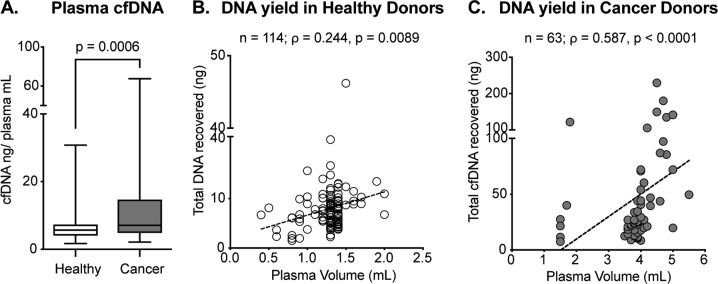
Fig. 1. Total cfDNA yield of plasma samples deriving from healthy donors or cancer patients.
a cfDNA concentration in plasma of healthy individuals compared to cancer patients (Mann–Whitney p = 0.0006). Median, interquartile range, and minimum/maximum are shown in the boxplot. b Correlation of plasma volume and the total cfDNA output in healthy donors (n = 114, Spearman ρ = 0.244, p = 0.0089). c Correlation between the plasma volume and the total cfDNA output in cancer patients (n = 63, Spearman ρ = 0.587, p < 0.0001)

