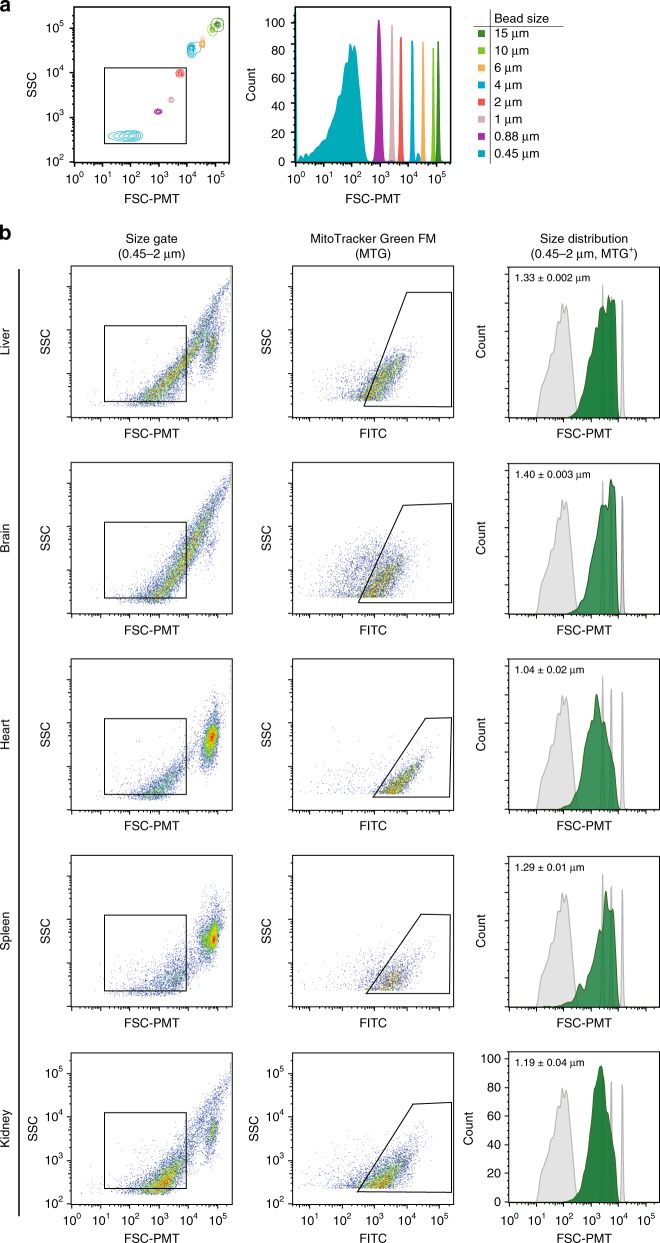
Fig. 2.
Mitochondrial isolation from mouse tissues using FAMS based on size and a mitochondrial-specific fluorescent probe. a Size calibration beads were used to distinguish events down to 0.45 μm. b In dissociated tissues stained with MitoTracker™ Green (MTG), events restricted via size gating to ~0.45–2 μm were assessed, and MTG-positive (MTG-labeled) events were detected in all samples analyzed (liver, brain, heart, spleen, kidney). MTG-positive events, shown in green, were assessed by FSC–PMT in reference to size calibration particles (shown in gray) to demonstrate size variability by tissue type, with the approximate mean diameter for each indicated; mean ± SEM, n = 3

