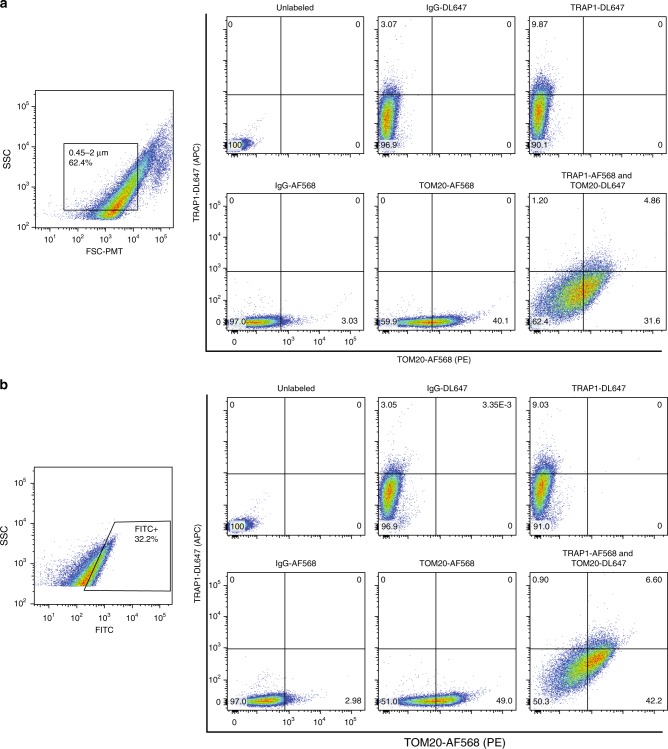
Fig. 4.
FAMS analysis of mitochondrial subpopulations in mouse liver tissue via TOM20 and TRAP1 antibody labeling. a Mouse liver cells were stained with MTG followed by labeling with anti-TOM20, anti-TRAP1, and AlexaFluor 568 or DyLight 647-conjugated secondary antibodies, respectively. Lysates were analyzed for TOM20 and TRAP1 colabeling of mitochondria using only a 0.45–2 μm size parental gate, or b through the 0.45–2 μm size gate in addition to a parental gate for MTG-positive events

