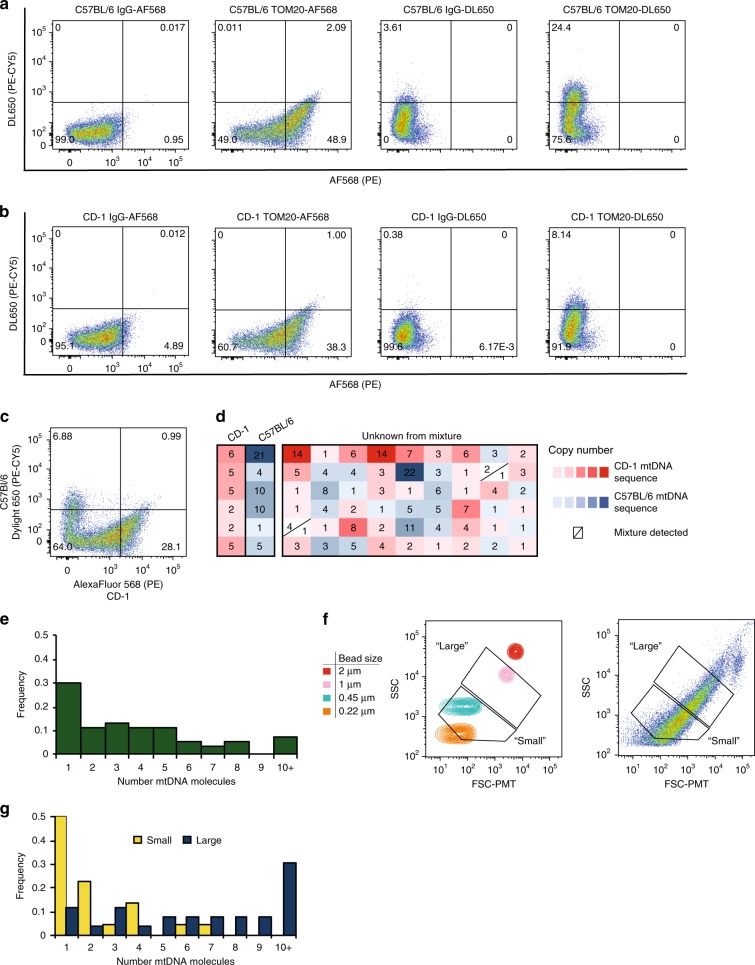
Fig. 6.
Analysis of mitochondrial heterogeneity by single organelle isolation and single molecule PCR. Mouse liver cells were stained with MTG and labeled with anti-TOM20 and AlexaFluor 568 or DyLight 650. Lysates were analyzed by size gating through 0.45–2 μm, followed by gating MTG-positive events. a C57BL/6 cell lysates were labeled with either secondary antibody, and gates were set based on isotype matched controls. b CD-1 lysates were labeled with either secondary antibody and gates were set based on isotype matched controls. c Following MTG staining, anti-TOM20 immunolabeling, and strain-specific secondary antibody labeling (CD-1:AF568, C57BL/6:DL650) separable populations could be resolved from mixed-strain samples. d Individual mitochondria were analyzed for mtDNA copy number. Each box represents a single mitochondrion with strain identified by sequencing (red:CD-1; blue:C57BL/6; white indicates mixture) and color-intensity associated with mtDNA copy number (light, low copy number; dark, high copy number). e Single mitochondria sorted from mixed strain samples based only on MTG-staining contained 1–10+ mtDNA molecules. f To sort single mitochondria from specific size ranges, size gates were determined based on nanoparticles to select events corresponding to ~0.22–0.5 μm (small) or 0.5–1 μm (large) mitochondria. g Mitochondrial copy number was calculated for individual mitochondria sorted from small or large size gates

