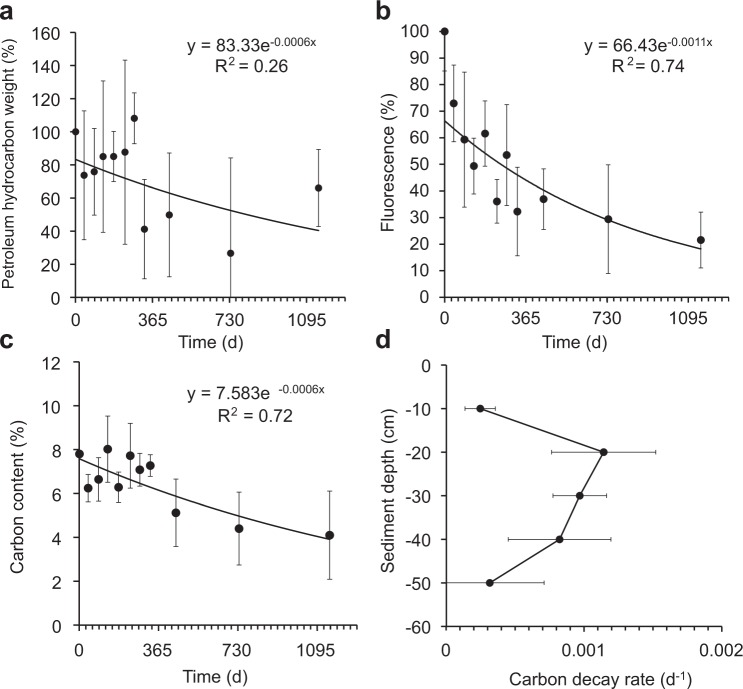
Figure 2.
Decreases in sSOA mass, fluorescence and carbon during the in-situ experiment and carbon decay rates (a) Decrease of the mass of the hydrocarbons in the sSOAs (starting weight = 100%). The relatively large variability was caused by the sand grains adhering to the sSOAs. (b) Decrease of average sSOA fluorescence. (c) sSOA carbon loss over time. (d) sSOA carbon content decay at different sediment depths. Error bars depict one standard deviation.

