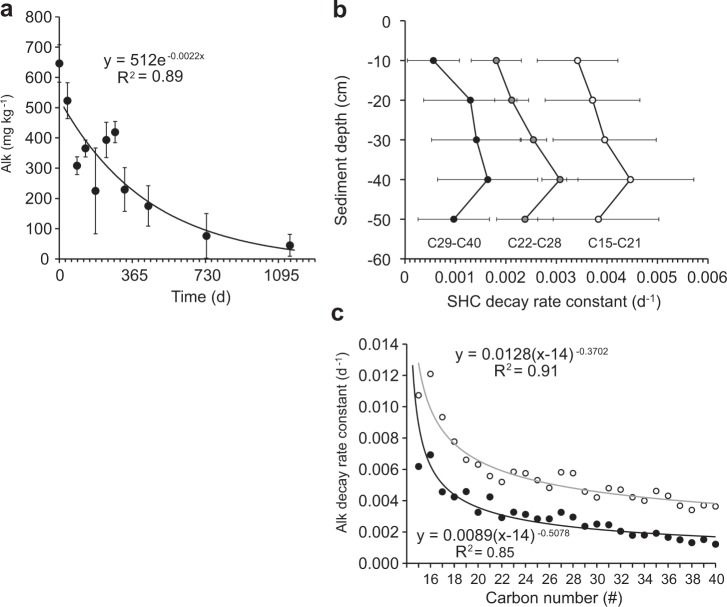
Figure 3.
Alkane degradation in the sSOAs during the experiment. (a) Degradation of the total n-alkanes. (b) Decay rate constants for n-alkanes at the different sediment depths. Rate constants are averaged according to carbon numbers 15–21, 22–28 and 29–40. (c) Decay rate constants for C15-C40 n-alkanes determined for the initial half-year (open symbols, grey line) and the 3-year time period of the experiment (solid symbols, black line).

