Figure 6.
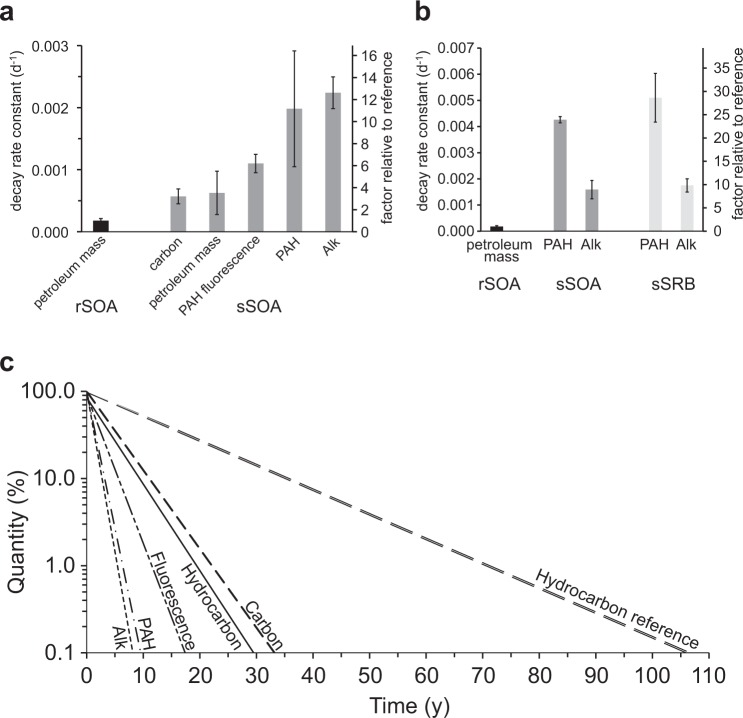
Summary of decay rates and projections. (a) Decay rates of rSOAs and sSOAs. The factor relative to reference relates the decay rates to the mass loss rate of the reference rSOA kept in the dark at constant temperature. Error bars depict standard error. (b) Decay rates of rSOAs, sSOAs and sSRBs during the first 9 months for which sSRB data are available. (c) Projections of petroleum hydrocarbon decomposition in sSOAs based on the decay rate constants determined in our study. Lines depict percent quantity remaining versus time. sSOA carbon content decreases slower than sSOA petroleum hydrocarbon mass (which includes oxyhydrocarbons) because small amounts of inorganic carbon may be contained in the sSOAs. Fluorescence decays slower than the GC/MS amenable PAHs as some oxidized PAHs retain fluorescence. Petroleum hydrocarbon mass in the reference rSOAs kept in the dark at constant temperature decays slower because the rSOAs were not exposed to the complex microbial community in the beach sand and the sedimentary environmental settings.

