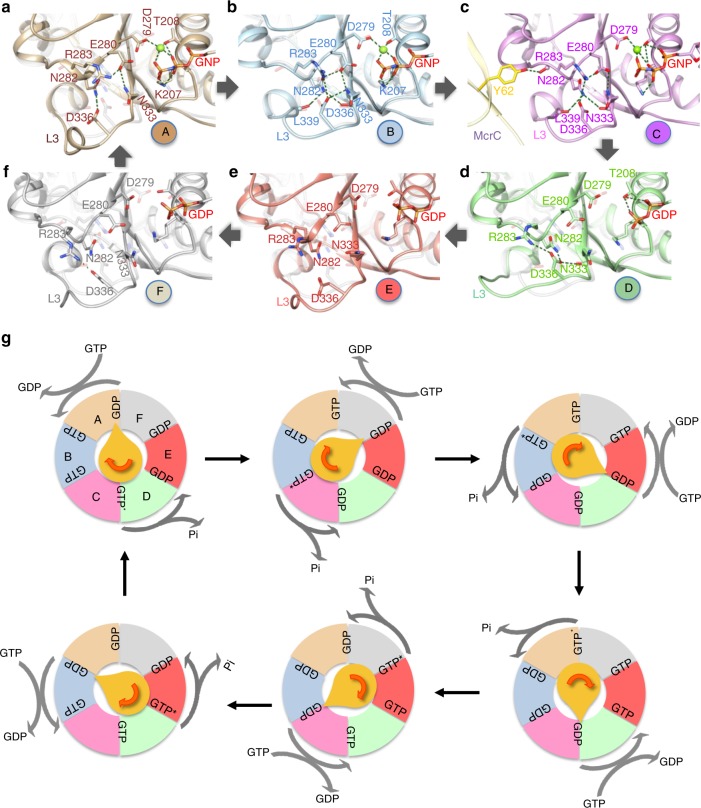
Fig. 4.
Sequential GTP hydrolysis by McrBC. a–f A zoom of loop L3 of McrB∆N protomers highlighting the conformational changes in them and the interaction network with the catalytically important McrB-Glu280 and Asn333. Overlaid on each panel is the faded image of this region in protomer C. The panels are arranged to follow the clockwise cyclic arrangement of the protomers in the hexamer. g A schematic model illustrating the McrC (yellow) stimulated GTP hydrolysis by McrB. For clarity, only one hexamer and an McrC monomer are shown, and the ring is viewed from the McrC side as in Fig. 3a. GTP* represents the transition state. The pointed end of McrC is located at the interface of GDP-to-GTP exchange and the rounded end is at the interface of GTP hydrolysis

