Fig. 1.
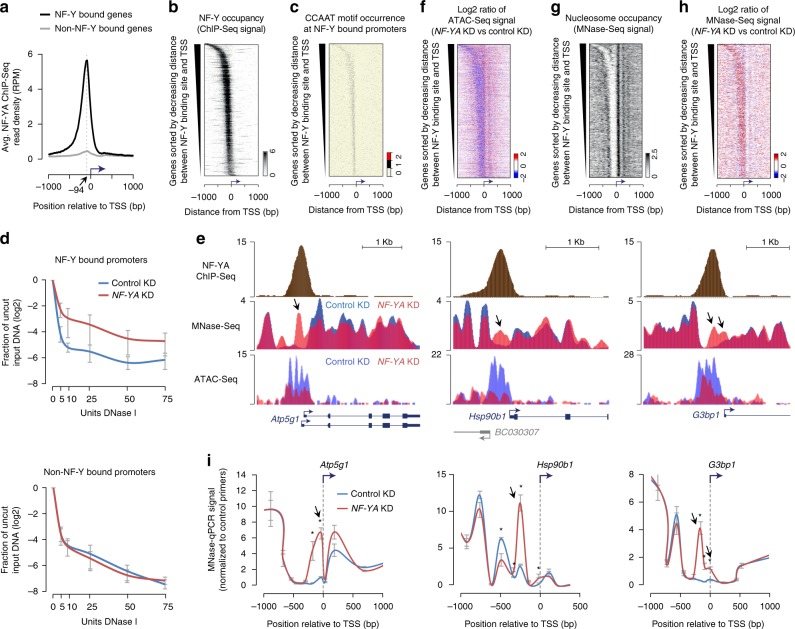
NF-Y binding at gene promoters protects the nucleosome-depleted region (NDR) from nucleosome encroachment. a Average NF-YA occupancy (y-axis), as measured using ChIP-Seq, near transcription start sites (TSSs) of genes with (black, n = 3191) or without (gray, n = 21,195) promoter-proximal NF-Y binding in mouse ESCs. RPM, reads per million mapped reads. b NF-YA occupancy near TSSs of genes with promoter-proximal NF-Y binding. c CCAAT motif occurrence near TSSs of genes with promoter-proximal NF-Y binding. d DNase I hypersensitivity and qPCR analysis of promoters with (top; n = 6) or without (bottom; n = 4) NF-Y binding in control (blue) and NF-YA KD (red) ESCs. Error bars, SEM. The data for individual promoters shown in Supplementary Fig. 1f, g. e Genome browser shots of candidate NF-Y target genes showing nucleosome occupancy in control (blue) or NF-YA KD (red) ESCs. Gene structure is shown at the bottom. Arrows highlight nucleosomal gain in NF-YA KD cells over what was previously a well-defined NDR in control KD cells. f Relative change (log2) in chromatin accessibility, as measured using ATAC-Seq, near TSSs of genes with promoter-proximal NF-Y binding in NF-YA KD vs. control KD ESCs. g Nucleosome occupancy (RPKM), as measured using MNase-Seq, near TSSs of genes with promoter-proximal NF-Y binding in control ESCs. RPKM, reads per one kilobase per one million mapped reads. h Relative change (log2) in nucleosome occupancy near TSSs of genes with promoter-proximal NF-Y binding in NF-YA KD vs control KD cells. i MNase-qPCR validation of MNase-Seq data shown in Fig. 1 e. Error bars, SEM of three biological replicates. *P-value < 0.04 (Student’s t test, two-sided)

