Fig. 2.
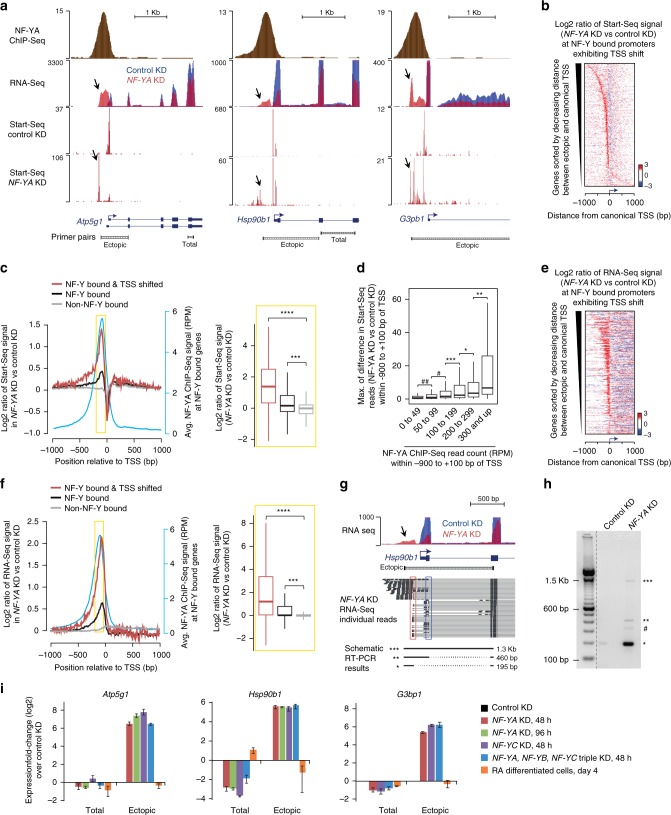
NF-Y binding influences PIC positioning and TSS selection. a Genome browser shots of NF-Y target genes in ESCs showing NF-YA occupancy (ChIP-Seq), transcription initiation-associated RNA enrichment (Start-Seq), and gene expression (RNA-Seq) in control and NF-YA KD ESCs. Arrows highlight regions with ectopic transcription initiation or RNA in NF-YA KD cells. Gene structure is shown at the bottom along with PCR amplicons used for RT-qPCR analysis in Fig. 2i. b Relative fold change (log2) in Start-Seq signal (red, gain; blue, loss) near TSSs of NF-Y-bound genes exhibiting TSS shifts (n = 538) in NF-YA KD vs control KD cells. c Left: average fold change (log2) in Start-Seq signal near TSSs of NF-Y bound genes exhibiting TSS shifts (red), NF-Y-bound genes (black), and non-NF-Y-bound genes (gray) in NF-YA KD vs. control KD cells. Also shown is the average NF-YA occupancy (blue; secondary y-axis) in ESCs. Right: box plot showing the distribution of fold changes in Start-Seq signal (in NF-YA KD vs. control KD ESCs) within the upstream proximal-promoter regions (−200 bp to −50 bp; highlighted in yellow). ***P-value = 1.01E-66, ****P-value = 3.53E-128 (Wilcoxon rank-sum test, two sided) d Box plot showing the distribution of maximum differences in Start-Seq read count between control and NF-YA KD cells within the region upstream of TSS (−900 to −25bp). A 10 -bp sliding window was used for computing read count differences. Genes with NF-Y binding were binned into six groups based on NF-YA ChIP-Seq read count within −900 to +100 bp of TSS. *P-value < 0.05, **P-value < 0.0009, ***P-value = 4.47E-07, #P-value = 1.16E-18, ##P-value = 2.49E-18 (Wilcoxon rank-sum test, two-sided). e Same as (b), but for RNA-Seq data. f Same as (c), but for RNA-Seq data. ***P-value = 5.39E-120, ****P-value = 3.44E-158 (Wilcoxon rank-sum test, two-sided). g, h Genome browser shot showing RNA-Seq signal at the Hsp90b1 gene in control (blue) or NF-YA KD (red) ESCs (g). Arrow highlights region with ectopic RNA in NF-YA KD cells. A representative selection of individual RNA-Seq reads is shown beneath. Red and blue rectangles highlight the ectopic and endogenous splice sites, respectively. Schematic of the RT-PCR results shown at the bottom represent the different PCR amplification products shown in (h). PCR amplification was performed using the “ectopic” primer pair shown underneath the gene structure (g). * denotes new isoform fragment (bypassing the canonical 5’UTR, TSS and the 1st exon), ** denotes mRNA fragment with prolonged 5′ fragment (uses the canonical 1st exon), *** denotes pre-mRNA fragment, and # denotes non-specific/unknown fragment. i RT-qPCR analysis of relative gene expression using the “total” and “ectopic” primer pairs shown in Fig. 2a. Data normalized to Actin, HAZ and TBP. Error bars, SEM of three to five biological replicates

