Fig. 4.
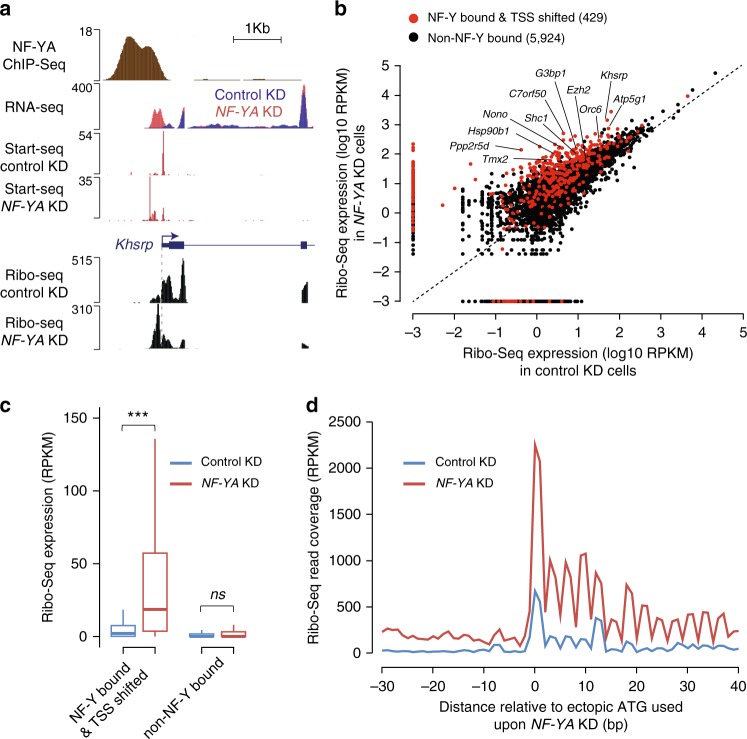
Transcripts originating from ectopic TSSs in NF-Y-depleted cells undergo translation. a Genome browser shot of NF-Y target gene Khsrp showing ribosome-protected RNA expression, as measured using Ribo-Seq, in control and NF-YA KD ESCs. Also shown are tracks for NF-YA ChIP-Seq, and RNA-Seq and Start-Seq in control and NF-YA KD ESCs. b Scatter plot showing the Ribo-Seq expression (coverage), in control (x-axis) and NF-YA KD (y-axis) ESCs, of the region between the ectopic (shifted) TSS and 25 bp upstream of the canonical TSS of genes with promoter-proximal NF-Y binding that exhibit a TSS shift (red). For comparison purposes, Ribo-Seq expression of the region between 115 bp (median TSS shift distance) and 25 bp upstream of TSS of genes with no promoter-proximal NF-Y binding is shown (black). RPKM, reads per kilobase per million mapped reads. c Box plot showing the Ribo-Seq expression, in control (blue) and NF-YA KD (red) ESCs, of the region between the ectopic TSS and 25 bp upstream of the canonical TSS of genes with promoter-proximal NF-Y binding that exhibit an ectopic TSS. For comparison purposes, Ribo-Seq expression of the region between 115 bp (median TSS shift distance) and 25 bp upstream of TSS of genes with no promoter-proximal NF-Y binding is shown. ***P-value = 8.21E-39 (Wilcoxon rank-sum test, two-sided). d Ribo-Seq read coverage, centered on the most likely ectopic start codon (ATG), in control and NF-YA KD ESCs. Only genes with promoter-proximal NF-Y binding that exhibit an ectopic TSS in NF-YA KD ESCs were used (n = 429)

