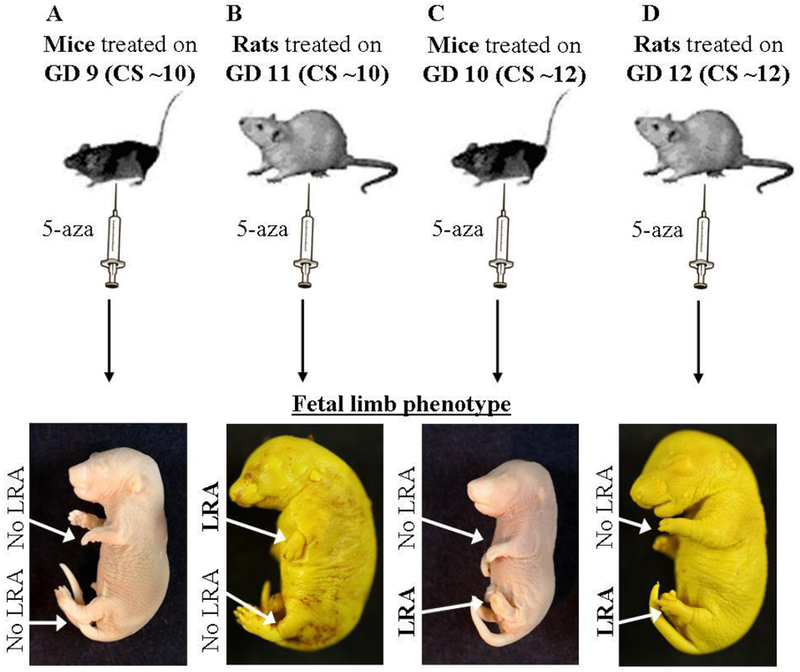
Figure 1: 5-aza-induced LRA models.

(A-D) Illustration (top) and images (bottom) of the mice and rats limb development models following 5-aza administration at the indicated developmental time points. Images were taken on GD 18. GD = Gestation Day; CS = Carnegie Stage.
