
Figure 3: miR-34 dose elevation is correlated to the limb developmental fate.
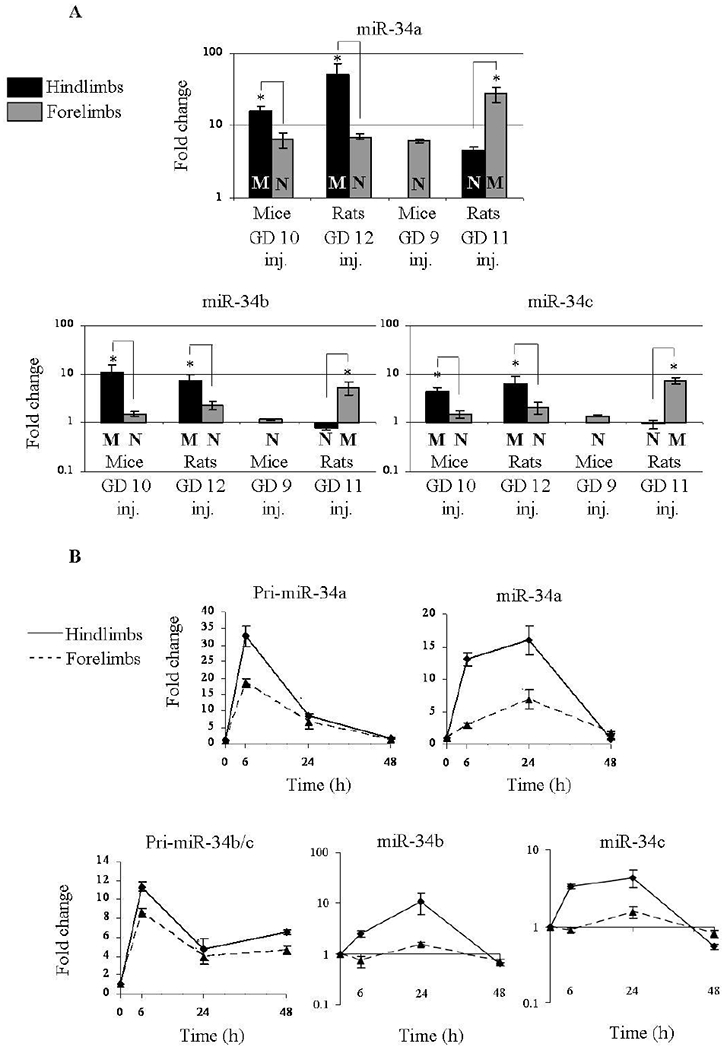
(A) Distinction between miR-34a, b, and c expression in the four models of limb development toxicity. Expression was determined 24 hours following 5-aza treatment. ‘M’/’N’ indicates Malformed/Normal limb development. (B) Expression kinetics of miR-34a, b and c and their pri-miRNA forms in mice hindlimb buds destined to be malformed and resistant forelimb buds in mice exposed to 5-aza on GD 10. (A+B) Fold change values were calculated relative to control animals and U6-snRNA as endogenous control. Results were analyzed statistically using the GT2 test for multiple comparisons and presented as 95% comparison intervals for the means. Means with intervals that do not overlap are significantly different (indicated by *). Means with intervals, which do not reach 1 (the level of expression in controls), differ significantly from controls.