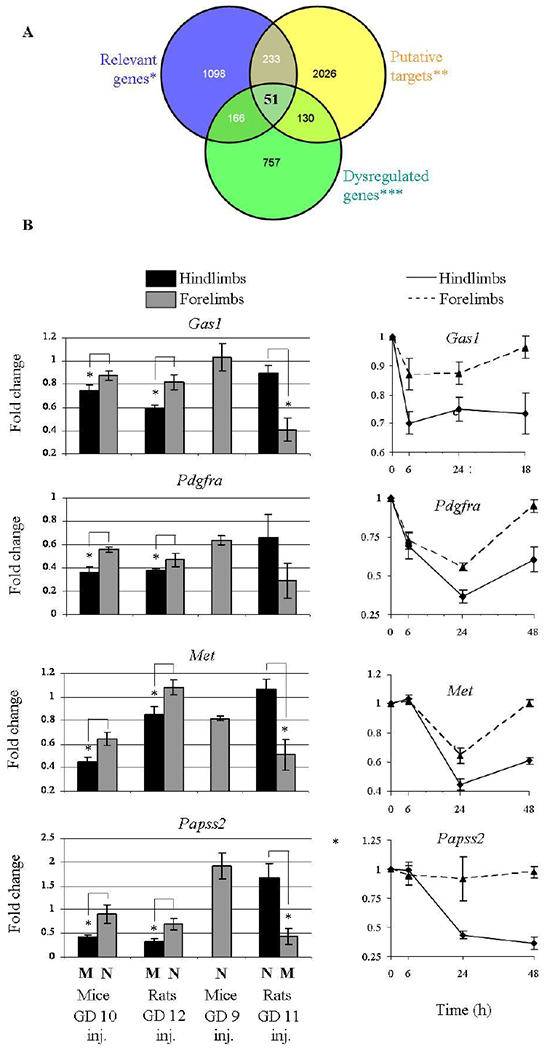
Figure 4: miR-34 family putative targets show an anti-correlative expression.

(A) A Venn diagram assisted target search by crossing data from ‘Relevant genes′ (genes with a relevant role for limb development), ′Putative targets′ for mice miR-34 according to TargetScan, and ′Dysregulated genes′ which are downregulated in mice hindlimbs destined to be malformed or upregulated in mice resistant forelimb buds (see Materials and Methods). (B) The expression of selected genes 24 hours following 5-aza treatment in the four models (left). Expression kinetics in mice hindlimb buds destined to be malformed together with resistant forelimb buds in mice exposed to 5-aza on GD 10. ‘M’/’N’ indicates Malformed/Normal limb development. The statistics methods were as described in Figure 3.
