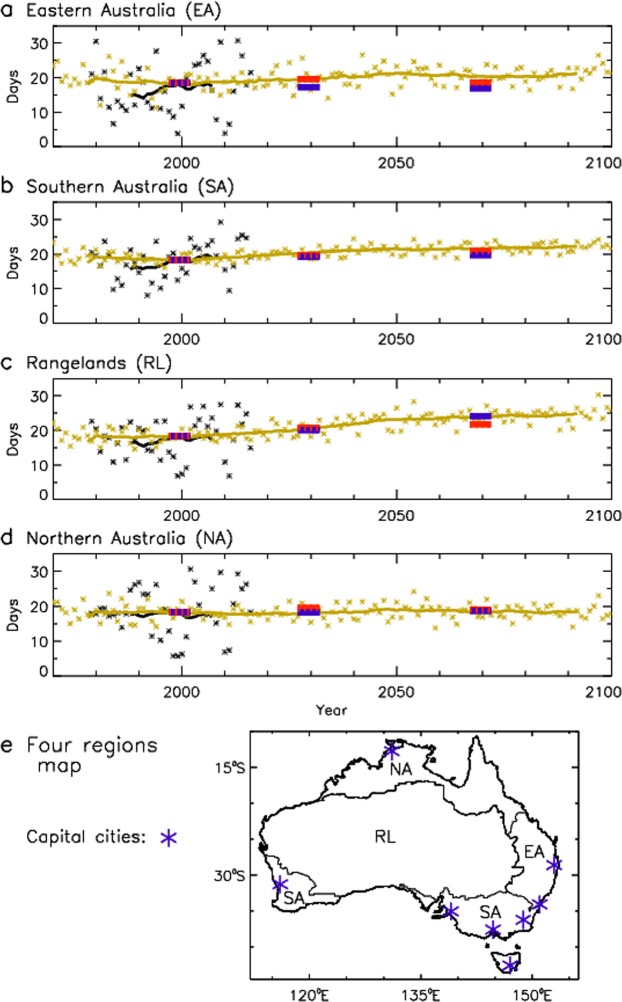
Figure 3.
Temporal changes in pyroconvection risk for four different climatic regions. Time series showing regional trends from 1970–2100 in the average number of days with CH greater than its 95th percentile at a given location. Results are presented for four regions: (a) Eastern Australia; (b) Southern Australia; (c) Rangelands; and (d) Northern Australia. (e) A map showing the four regions is provided, together with locations of capital cities of Australia. Results based on reanalysis cover the period 1979–2016 (shown in black) and ensemble mean values for GCMs cover the period 1970–2100 (shown in yellow), with ensemble mean values for CCAM (blue) and WRF (red) covering the periods 1990–2009, 2030–2049 and 2060–2079. A 20-year running mean (i.e., box-car average) is applied to highlight the climatological signal, with results for individual years also shown for the reanalysis and GCMs.

