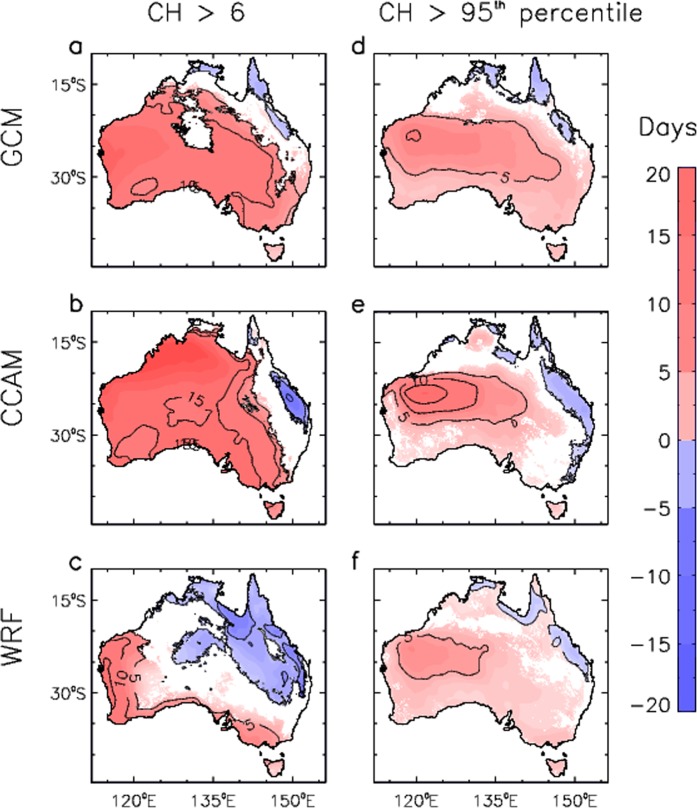
Figure 5.
Spatial changes in pyroconvection risk for three different modelling methods. Changes are shown for the number of days per year that the CH index exceeds a threshold value, based on changes from the period 1990–2009 to the period 2060–2079. Results are presented for the number of days per year that CH is above 6 for different data sets: (a) GCMs; (b) CCAM; and (c) WRF. Results are also presented for the number of days per year that CH is above its historical period 95th percentile for different data sets: (d) GCMs; (e) CCAM; and (f) WRF. Coloured regions represent locations where at least two thirds of the ensemble members for each modelling method agree of the sign of the change.

