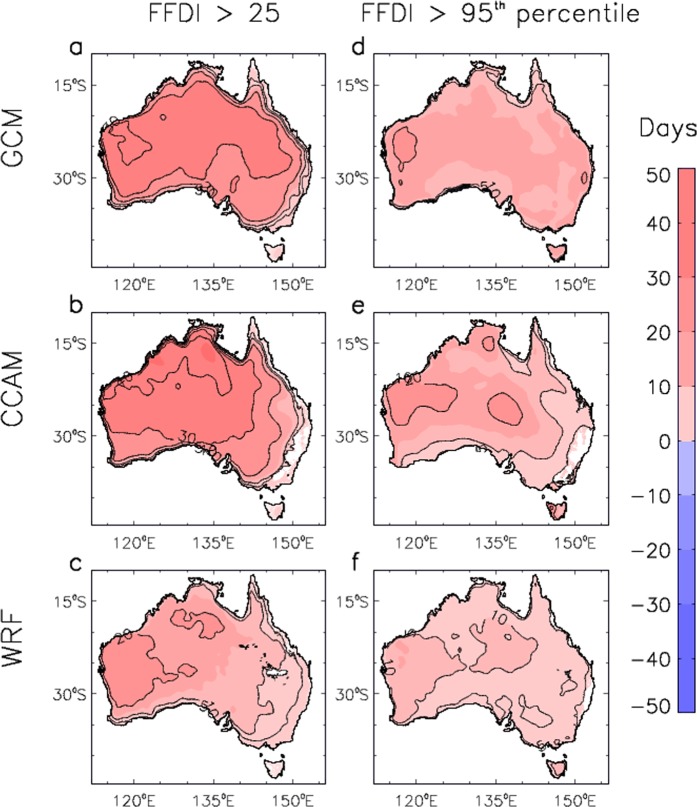
Figure 6.
Spatial changes in near-surface fire weather condition for three different modelling methods. Changes are shown for the number of days per year that the FFDI exceeds a threshold value, based on changes from the period 1990–2009 to the period 2060–2079. Results are presented for the number of days per year that FFDI is above 25 for different data sets: (a) GCMs; (b) CCAM; and (c) WRF. Results are also presented for the number of days per year that FFDI is above its historical period 95th percentile for different data sets: (d) GCMs; (e) CCAM; and (f) WRF. Coloured regions represent locations where at least two thirds of the ensemble members for each modelling method agree of the sign of the change.

