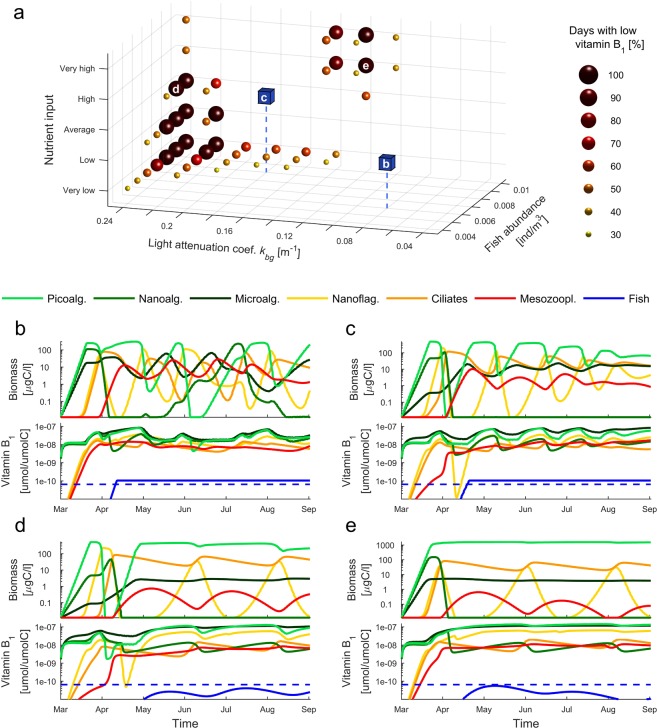
Figure 2.
Biomass and concentrations of vitamin B1 in modeled organisms. (a) Scenarios mapped on the tested parameter space of planktivorous fish abundance, background light attenuation and nutrient input. The empty spaces match the scenarios resulting in planktivorous fish rich in vitamin B1, i.e., with sustained concentrations of vitamin B1 above the levels recorded for Baltic populations of sprat and herring for more than 70% of the analyze time period (see the main text). Blue cubes represent the position of the scenarios with fish rich in vitamin B1 presented also in panels b and c (letters match the scenarios presented in b,c). Spheres represent scenarios resulting in a low level of vitamin B1 in planktivorous fish persisting for longer than 30% of the analyzed period (see the main text). Letters indicate the position of scenarios presented in (d,e). (b,c) Example scenarios with mass-specific vitamin B1 levels persisting for most of the time above average levels of vitamin B1 recorded for Baltic populations of sprat and herring (indicated by dashed line). (d,e) Example scenarios with low mass-specific vitamin B1 levels persisting for most of the time during the analyzed period. (b–e) Note the difference between scenarios, (b–e) in the dynamics of fluctuations of the modeled organisms.

