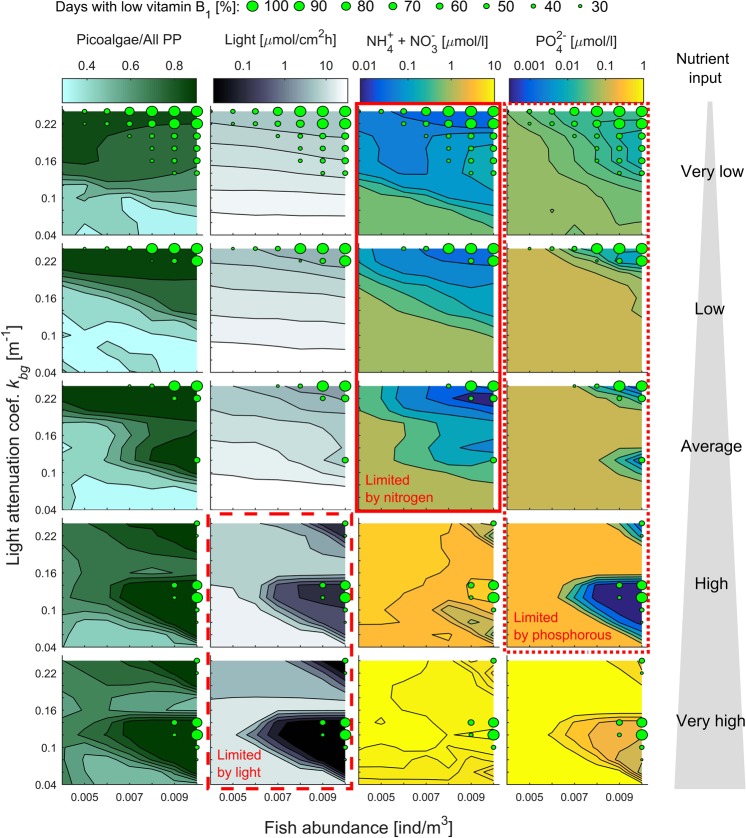
Figure 4.
Biotic and abiotic correlates of low vitamin B1 levels in planktivorous fish presented in gradients of fish abundance, background light attenuation and nutrient input (illustrated by the gray triangular shape). Cases with vitamin B1-poor planktivorous fish are indicated by green circles (see the legend). (Column 1) The average proportion of algae biomass located in picoalgae illustrates the degree to which the primary producer cell-size spectrum shifts toward the smallest primary producers. (Column 2) Total light penetrating the water column (median) from attenuation by primary producers (self-shading) and dissolved substances (background attenuation). Note, that the light attenuation is driven by background attenuation in scenarios with very low to average nutrient input and almost entirely by self-shading in scenarios with high and very high nutrient input. (Columns 3–4) Concentration of dissolved inorganic nitrogen and phosphorous (median). (Columns 2–4) Red rectangles outline the scenarios in which low levels of nitrogen, phosphorous and/or light fit with the observed low levels of vitamin B1 in planktivorous fish.

