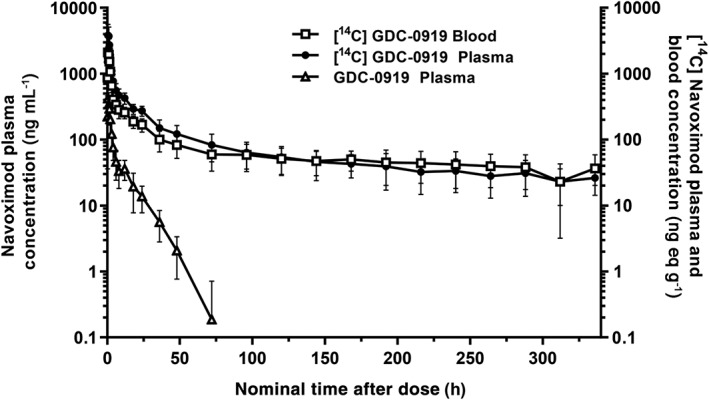
Figure 2.

Log‐linear mean (± SD) plasma concentration time profile of navoximod (open triangles), and mean (± SD) plasma (closed circle) and whole blood (open square) concentration profiles of [14C]‐navoximod following oral administration of 200 mg/600 μCi [14C]‐navoximod
